Copyright
©The Author(s) 2022.
World J Methodol. May 20, 2022; 12(3): 92-98
Published online May 20, 2022. doi: 10.5662/wjm.v12.i3.92
Published online May 20, 2022. doi: 10.5662/wjm.v12.i3.92
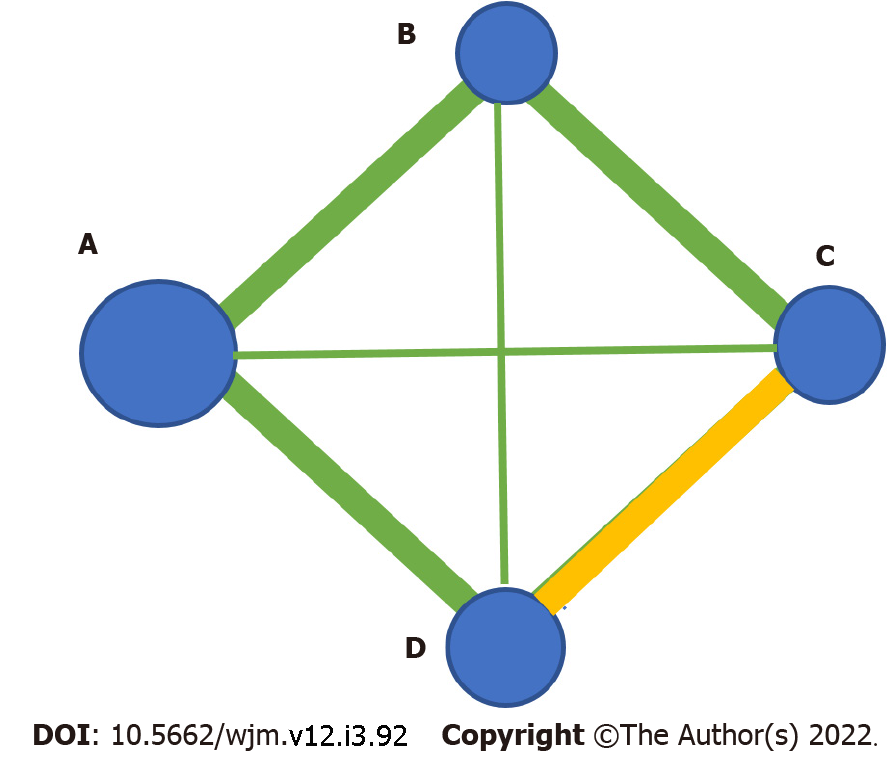
Figure 1 A Network-Meta-Analysis plot example.
Network meta-analysis plot including four competing interventions (i.e. A, B, C, and D). The nodes represent the included interventions with their size being proportional to sample size. The thickness of the edges connecting the nodes is reflected in the number of trials included in the given comparison. The edges depicted in green and yellow denote that the involved comparisons are at low and moderate risk of bias, respectively.
- Citation: Christofilos SI, Tsikopoulos K, Tsikopoulos A, Kitridis D, Sidiropoulos K, Stoikos PN, Kavarthapu V. Network meta-analyses: Methodological prerequisites and clinical usefulness. World J Methodol 2022; 12(3): 92-98
- URL: https://www.wjgnet.com/2222-0682/full/v12/i3/92.htm
- DOI: https://dx.doi.org/10.5662/wjm.v12.i3.92


