Copyright
©The Author(s) 2020.
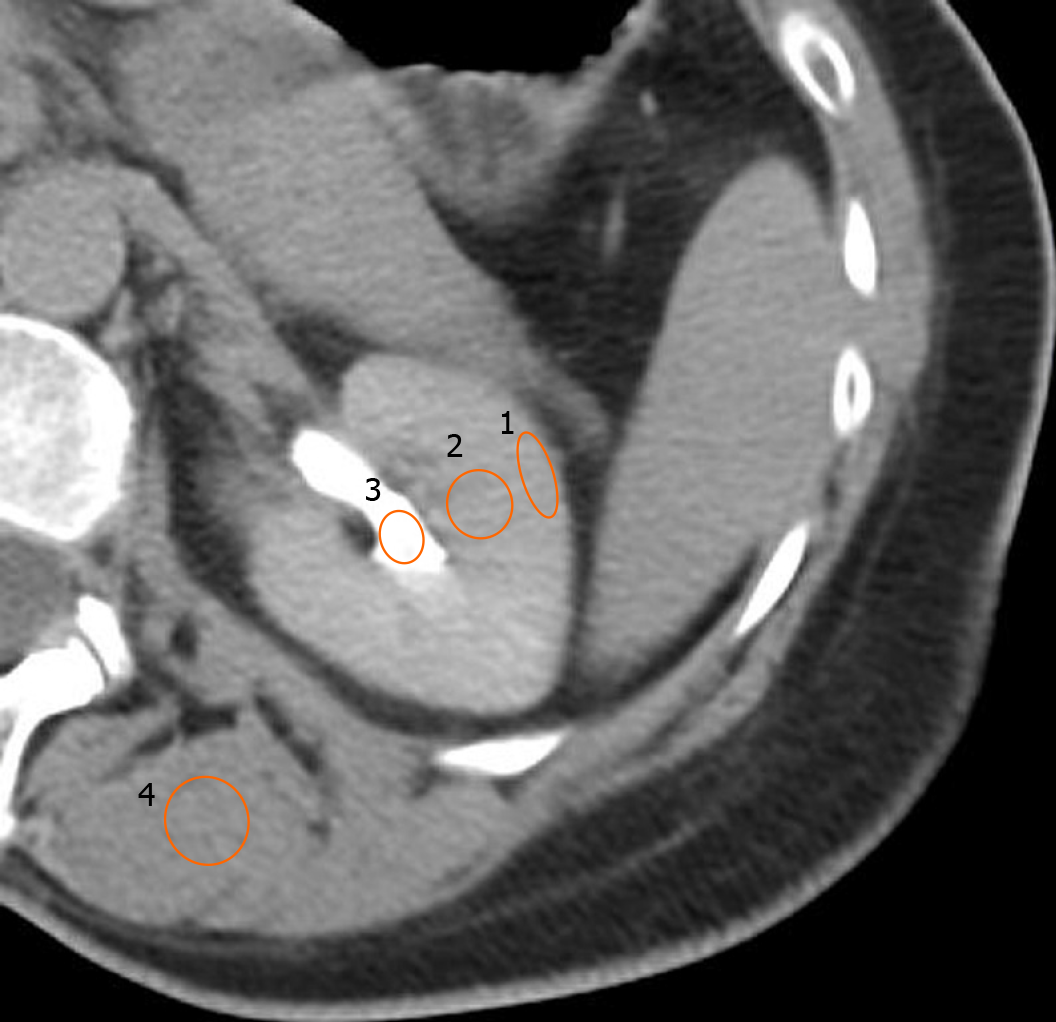
Figure 2 Example of Regions-of-interest drawn on the post-embolization non-contrast enhanced computed tomographic to determine the phase of renal enhancement.
ROI 1 measures the Hounsfield units (HU) of the renal cortex. ROI 2 measures the HU of the renal medulla. ROI 3 measures the HU of the renal pelvis. ROI 4 measures the HU of surrounding skeletal muscle. In this example, the renal enhancement phase is late excretory.
- Citation: Soliman MM, Sarkar D, Glezerman I, Maybody M. Findings on intraprocedural non-contrast computed tomographic imaging following hepatic artery embolization are associated with development of contrast-induced nephropathy . World J Nephrol 2020; 9(2): 33-42
- URL: https://www.wjgnet.com/2220-6124/full/v9/i2/33.htm
- DOI: https://dx.doi.org/10.5527/wjn.v9.i2.33


