Copyright
©The Author(s) 2019.
World J Nephrol. Oct 27, 2019; 8(6): 95-108
Published online Oct 27, 2019. doi: 10.5527/wjn.v8.i6.95
Published online Oct 27, 2019. doi: 10.5527/wjn.v8.i6.95
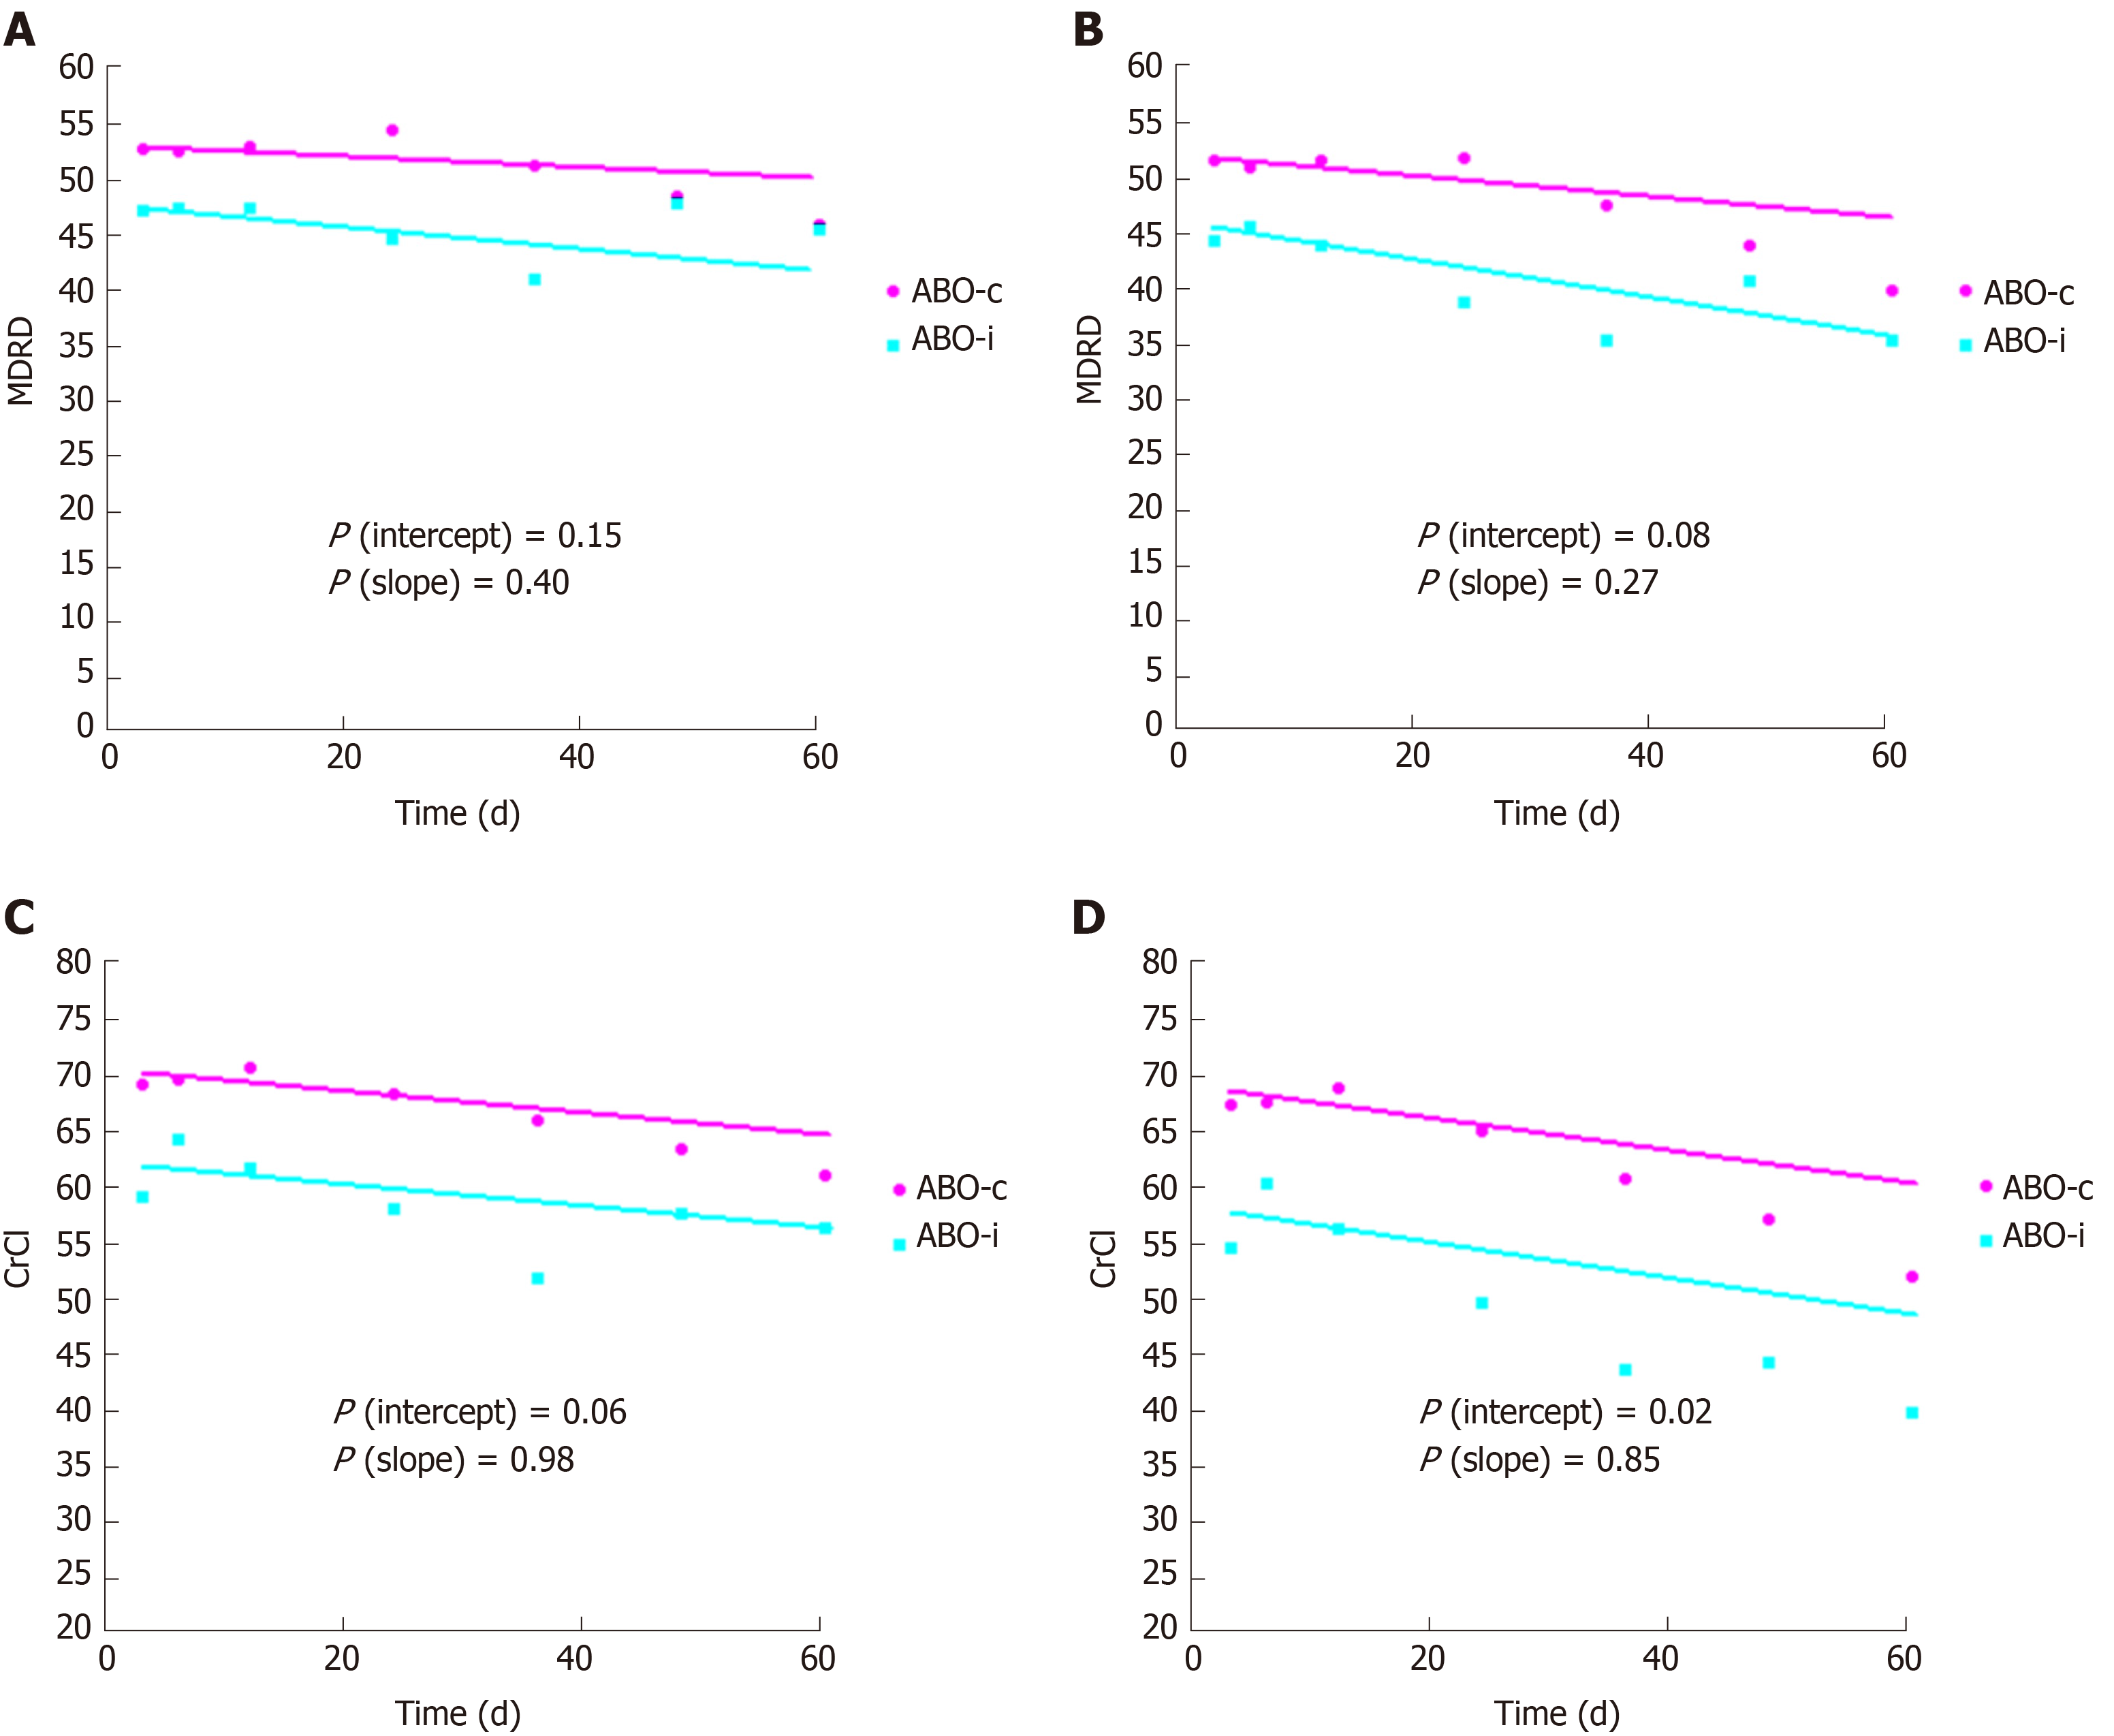
Figure 2 Kidney function.
A: Estimated glomerular filtration rate (Modification of Diet in Renal Disease) without imputation in case of graft loss; B: Estimated glomerular filtration rate (Modification of Diet in Renal Disease) with imputation of 10 mL/min/1.73 m2 in case of graft loss; C: Creatinine clearance without imputation in case of graft loss; D: Creatinine clearance with imputation of 10 mL/min/1.73 m2 in case of graft loss. Curves were estimated using linear mixed models. The dots indicate point estimates at 3, 6, 12, 24, 36, 48 and 60 months. CrCl: Creatinine clearance; MDRD: Modification of Diet in Renal Disease.
- Citation: van Sandwijk MS, Klooster A, ten Berge IJ, Diepstra A, Florquin S, Hoelbeek JJ, Bemelman FJ, Sanders JS. Complement activation and long-term graft function in ABO-incompatible kidney transplantation. World J Nephrol 2019; 8(6): 95-108
- URL: https://www.wjgnet.com/2220-6124/full/v8/i6/95.htm
- DOI: https://dx.doi.org/10.5527/wjn.v8.i6.95


