Copyright
©The Author(s) 2019.
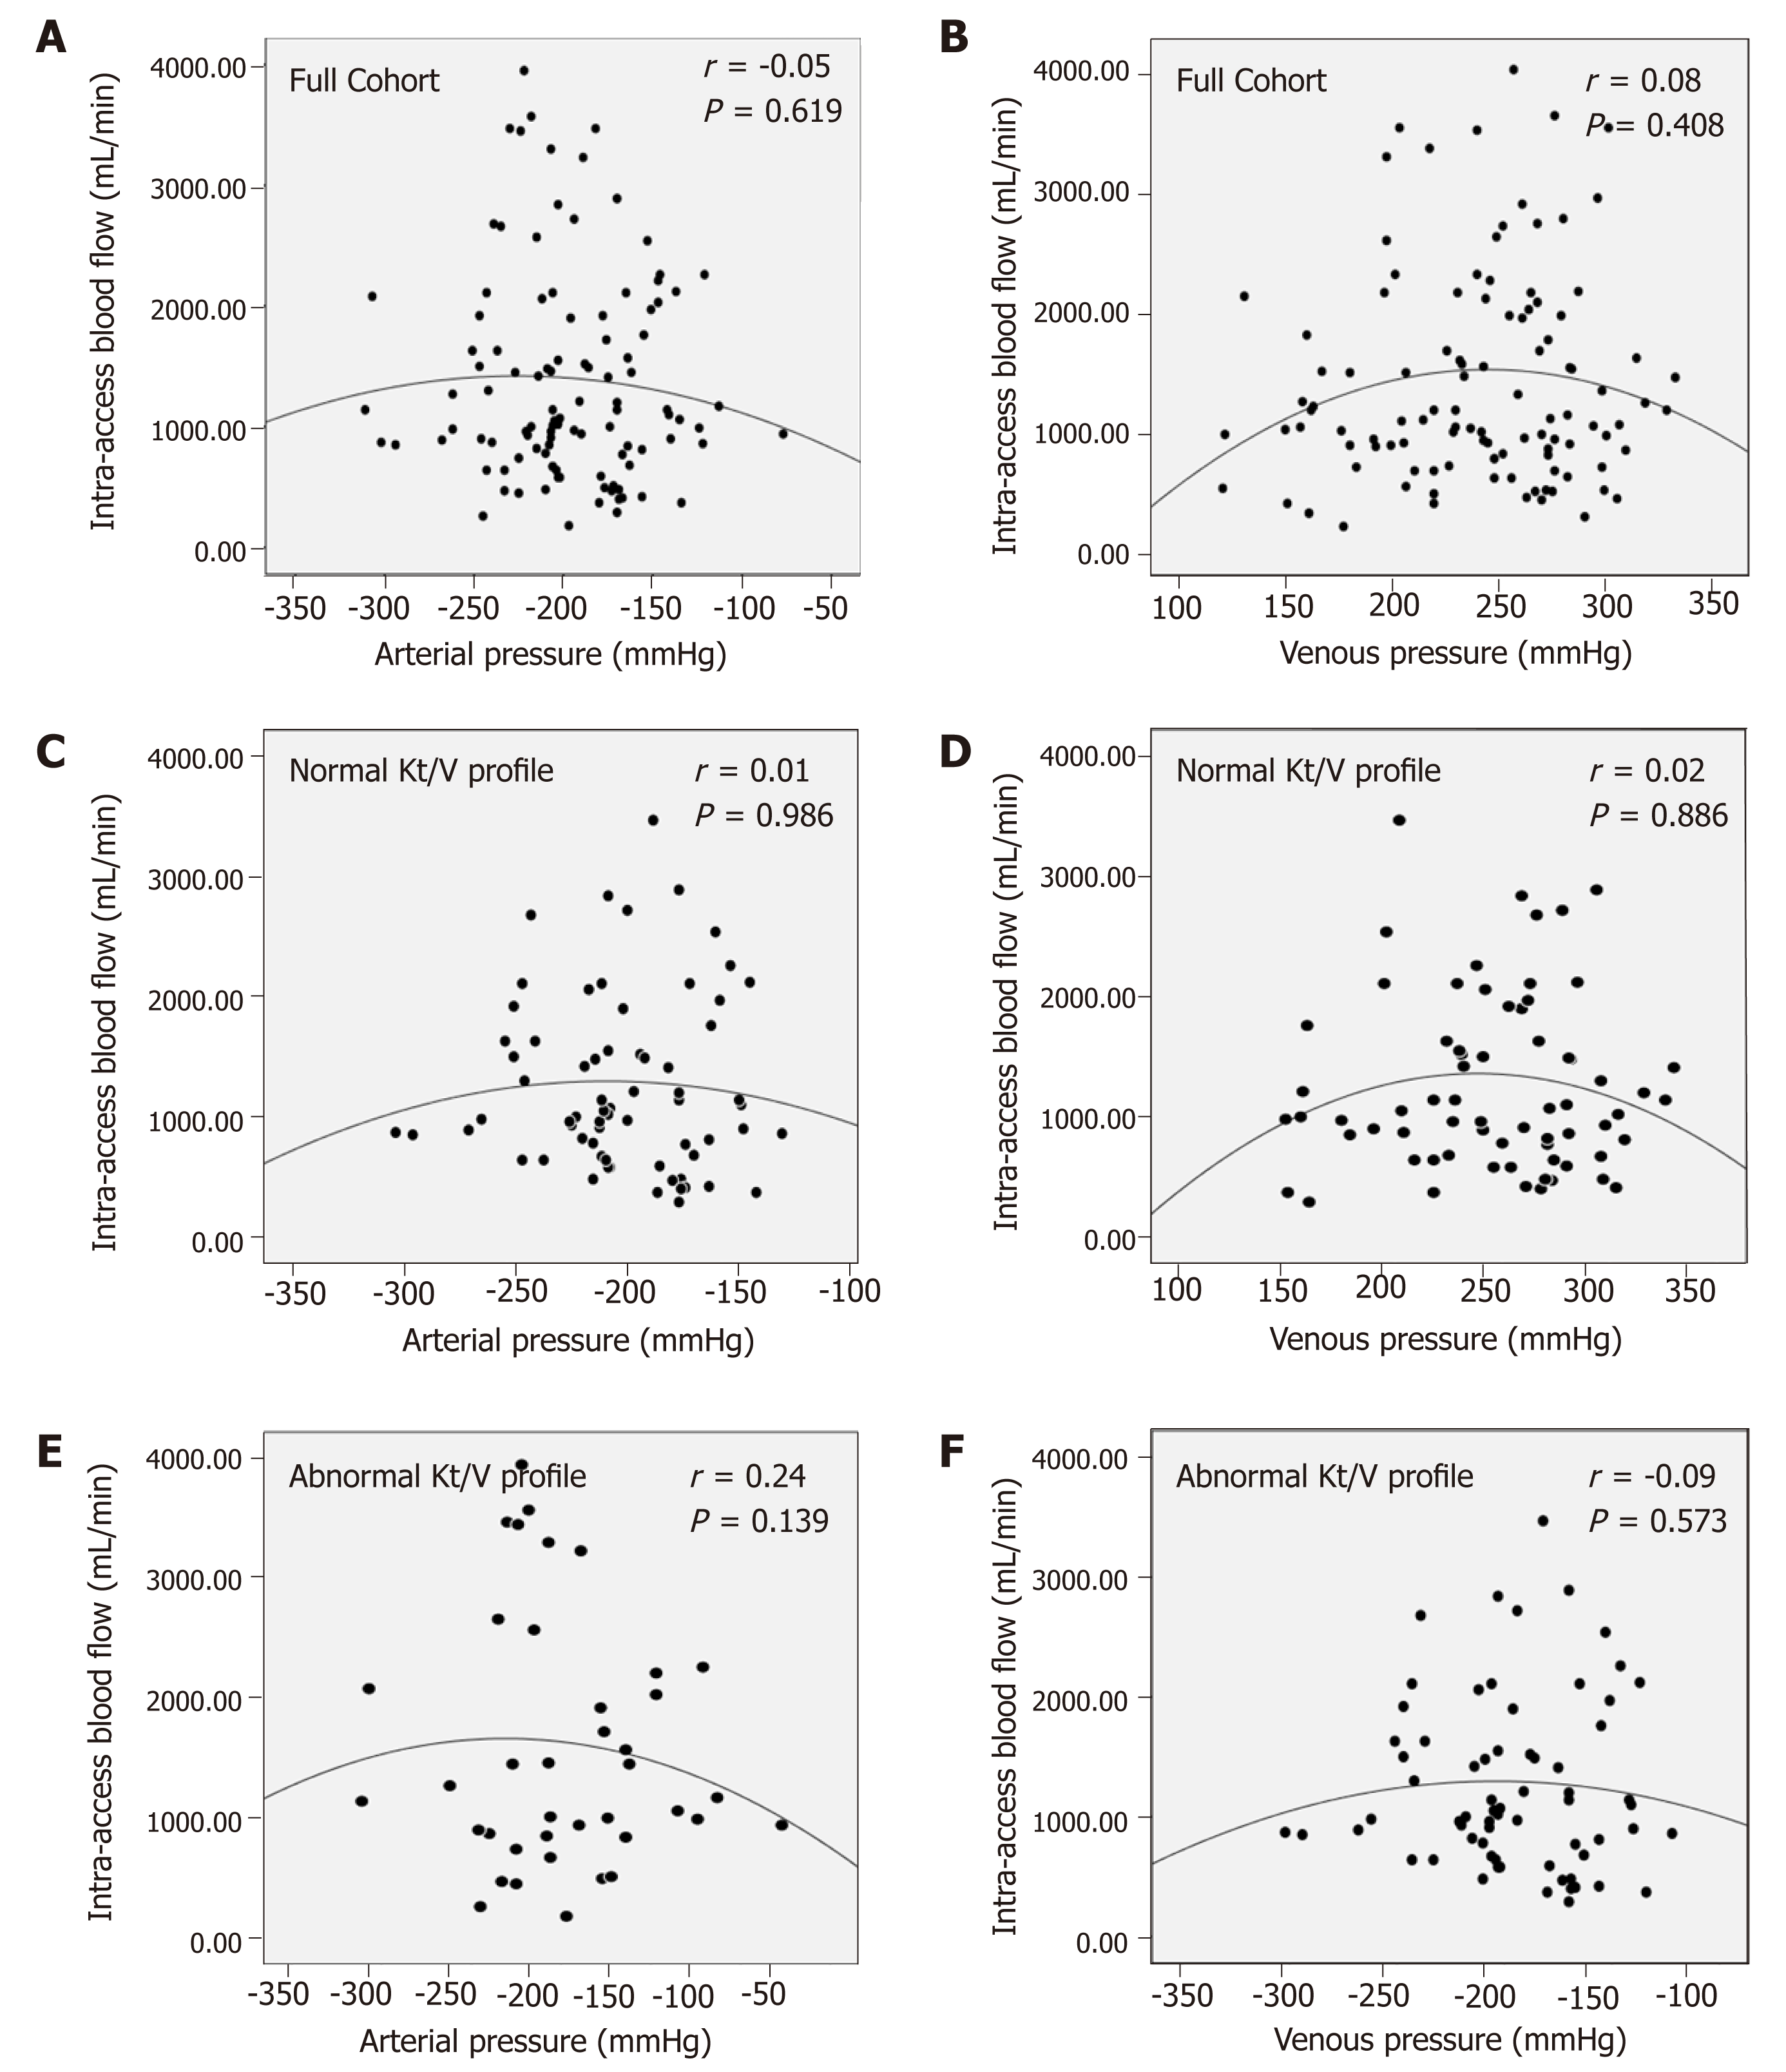
Figure 2 Relationship between intra-access blood flow and access (arterial and venous) pressures in the full cohort (A and B); normal Kt/V profile cohort (C and D) and the abnormal Kt/V profile cohort (E and F).
- Citation: Koratala A, Dass B, Alquadan KF, Sharma S, Singhania G, Ejaz AA. Static pressures, intra-access blood flow and dynamic Kt/V profiles in the prediction of dialysis access function. World J Nephrol 2019; 8(3): 59-66
- URL: https://www.wjgnet.com/2220-6124/full/v8/i3/59.htm
- DOI: https://dx.doi.org/10.5527/wjn.v8.i3.59


