Copyright
©The Author(s) 2019.
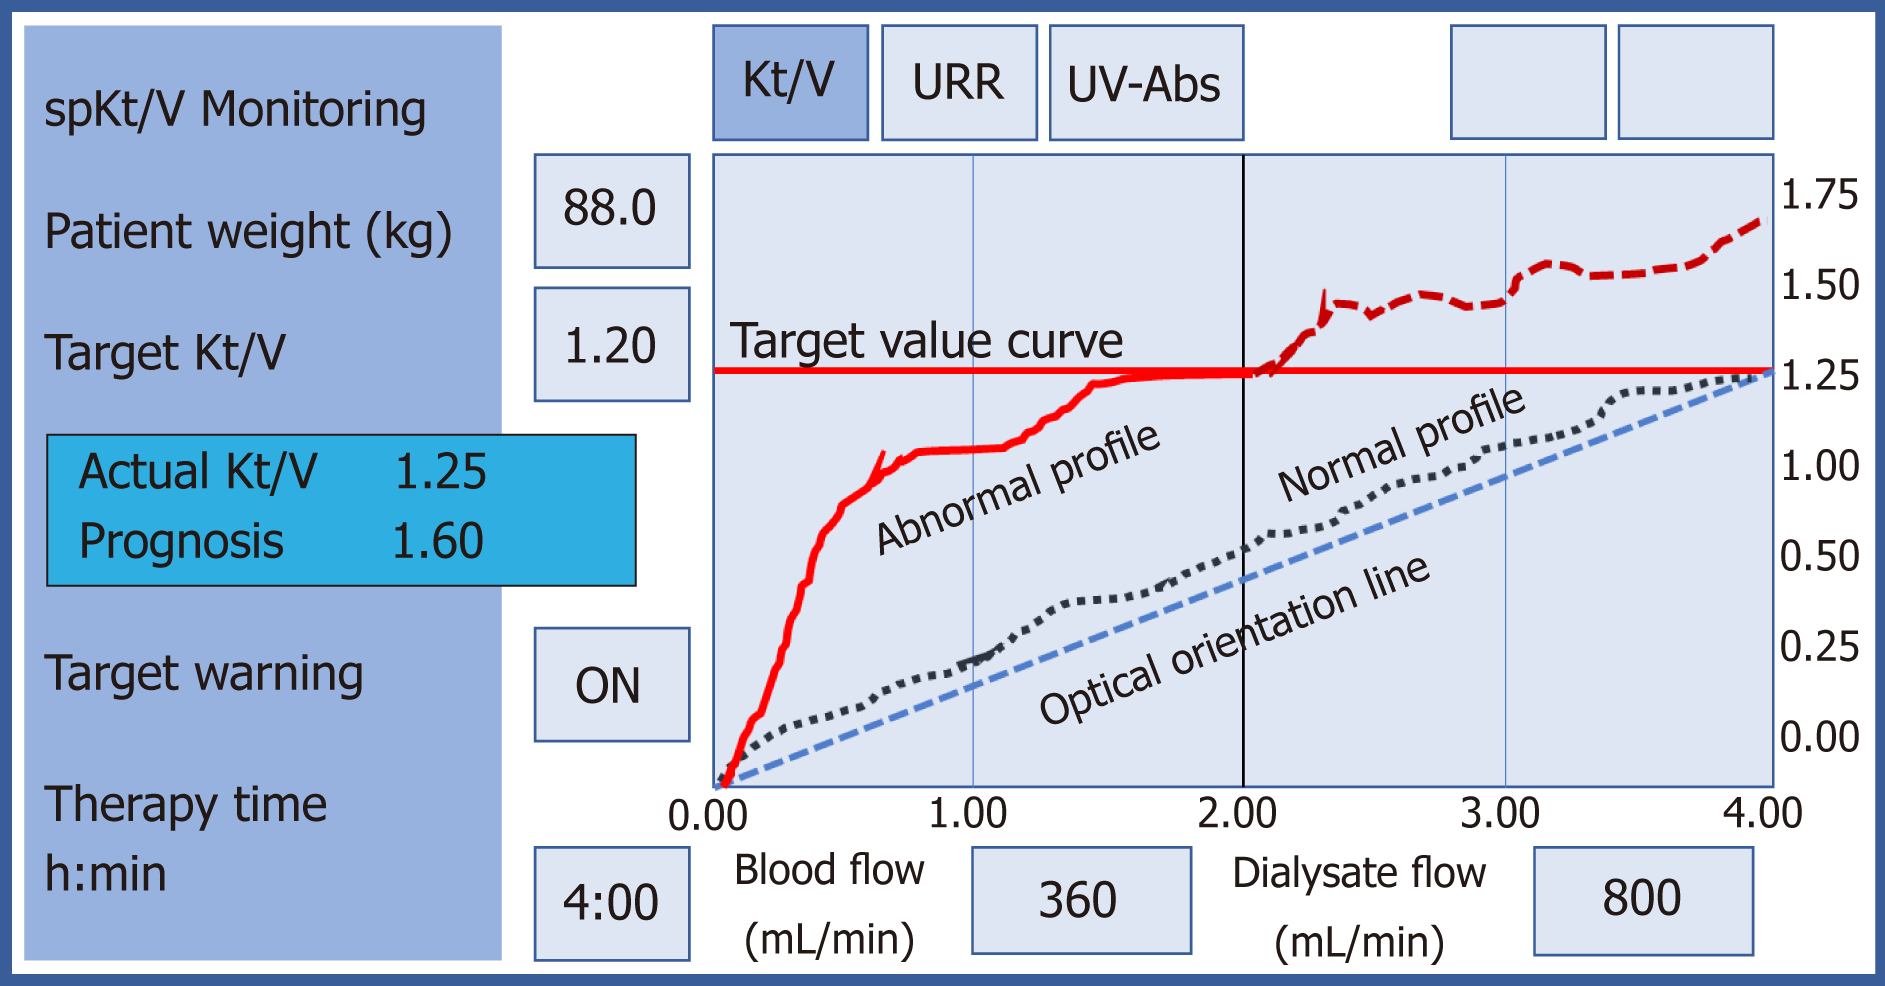
Figure 1 Depiction of continuous display of adequacy of dialysis throughout therapy (Kt/V profile) as seen on a hemodialysis machine monitor.
Optical orientation line depicts the ideal Kt/V profile. Normal Kt/V profile represents real-time values that closely mimic the optical orientation line. Abnormal Kt/V profile depicts major fluctuations from the optical orientation line.
- Citation: Koratala A, Dass B, Alquadan KF, Sharma S, Singhania G, Ejaz AA. Static pressures, intra-access blood flow and dynamic Kt/V profiles in the prediction of dialysis access function. World J Nephrol 2019; 8(3): 59-66
- URL: https://www.wjgnet.com/2220-6124/full/v8/i3/59.htm
- DOI: https://dx.doi.org/10.5527/wjn.v8.i3.59


