Copyright
©The Author(s) 2019.
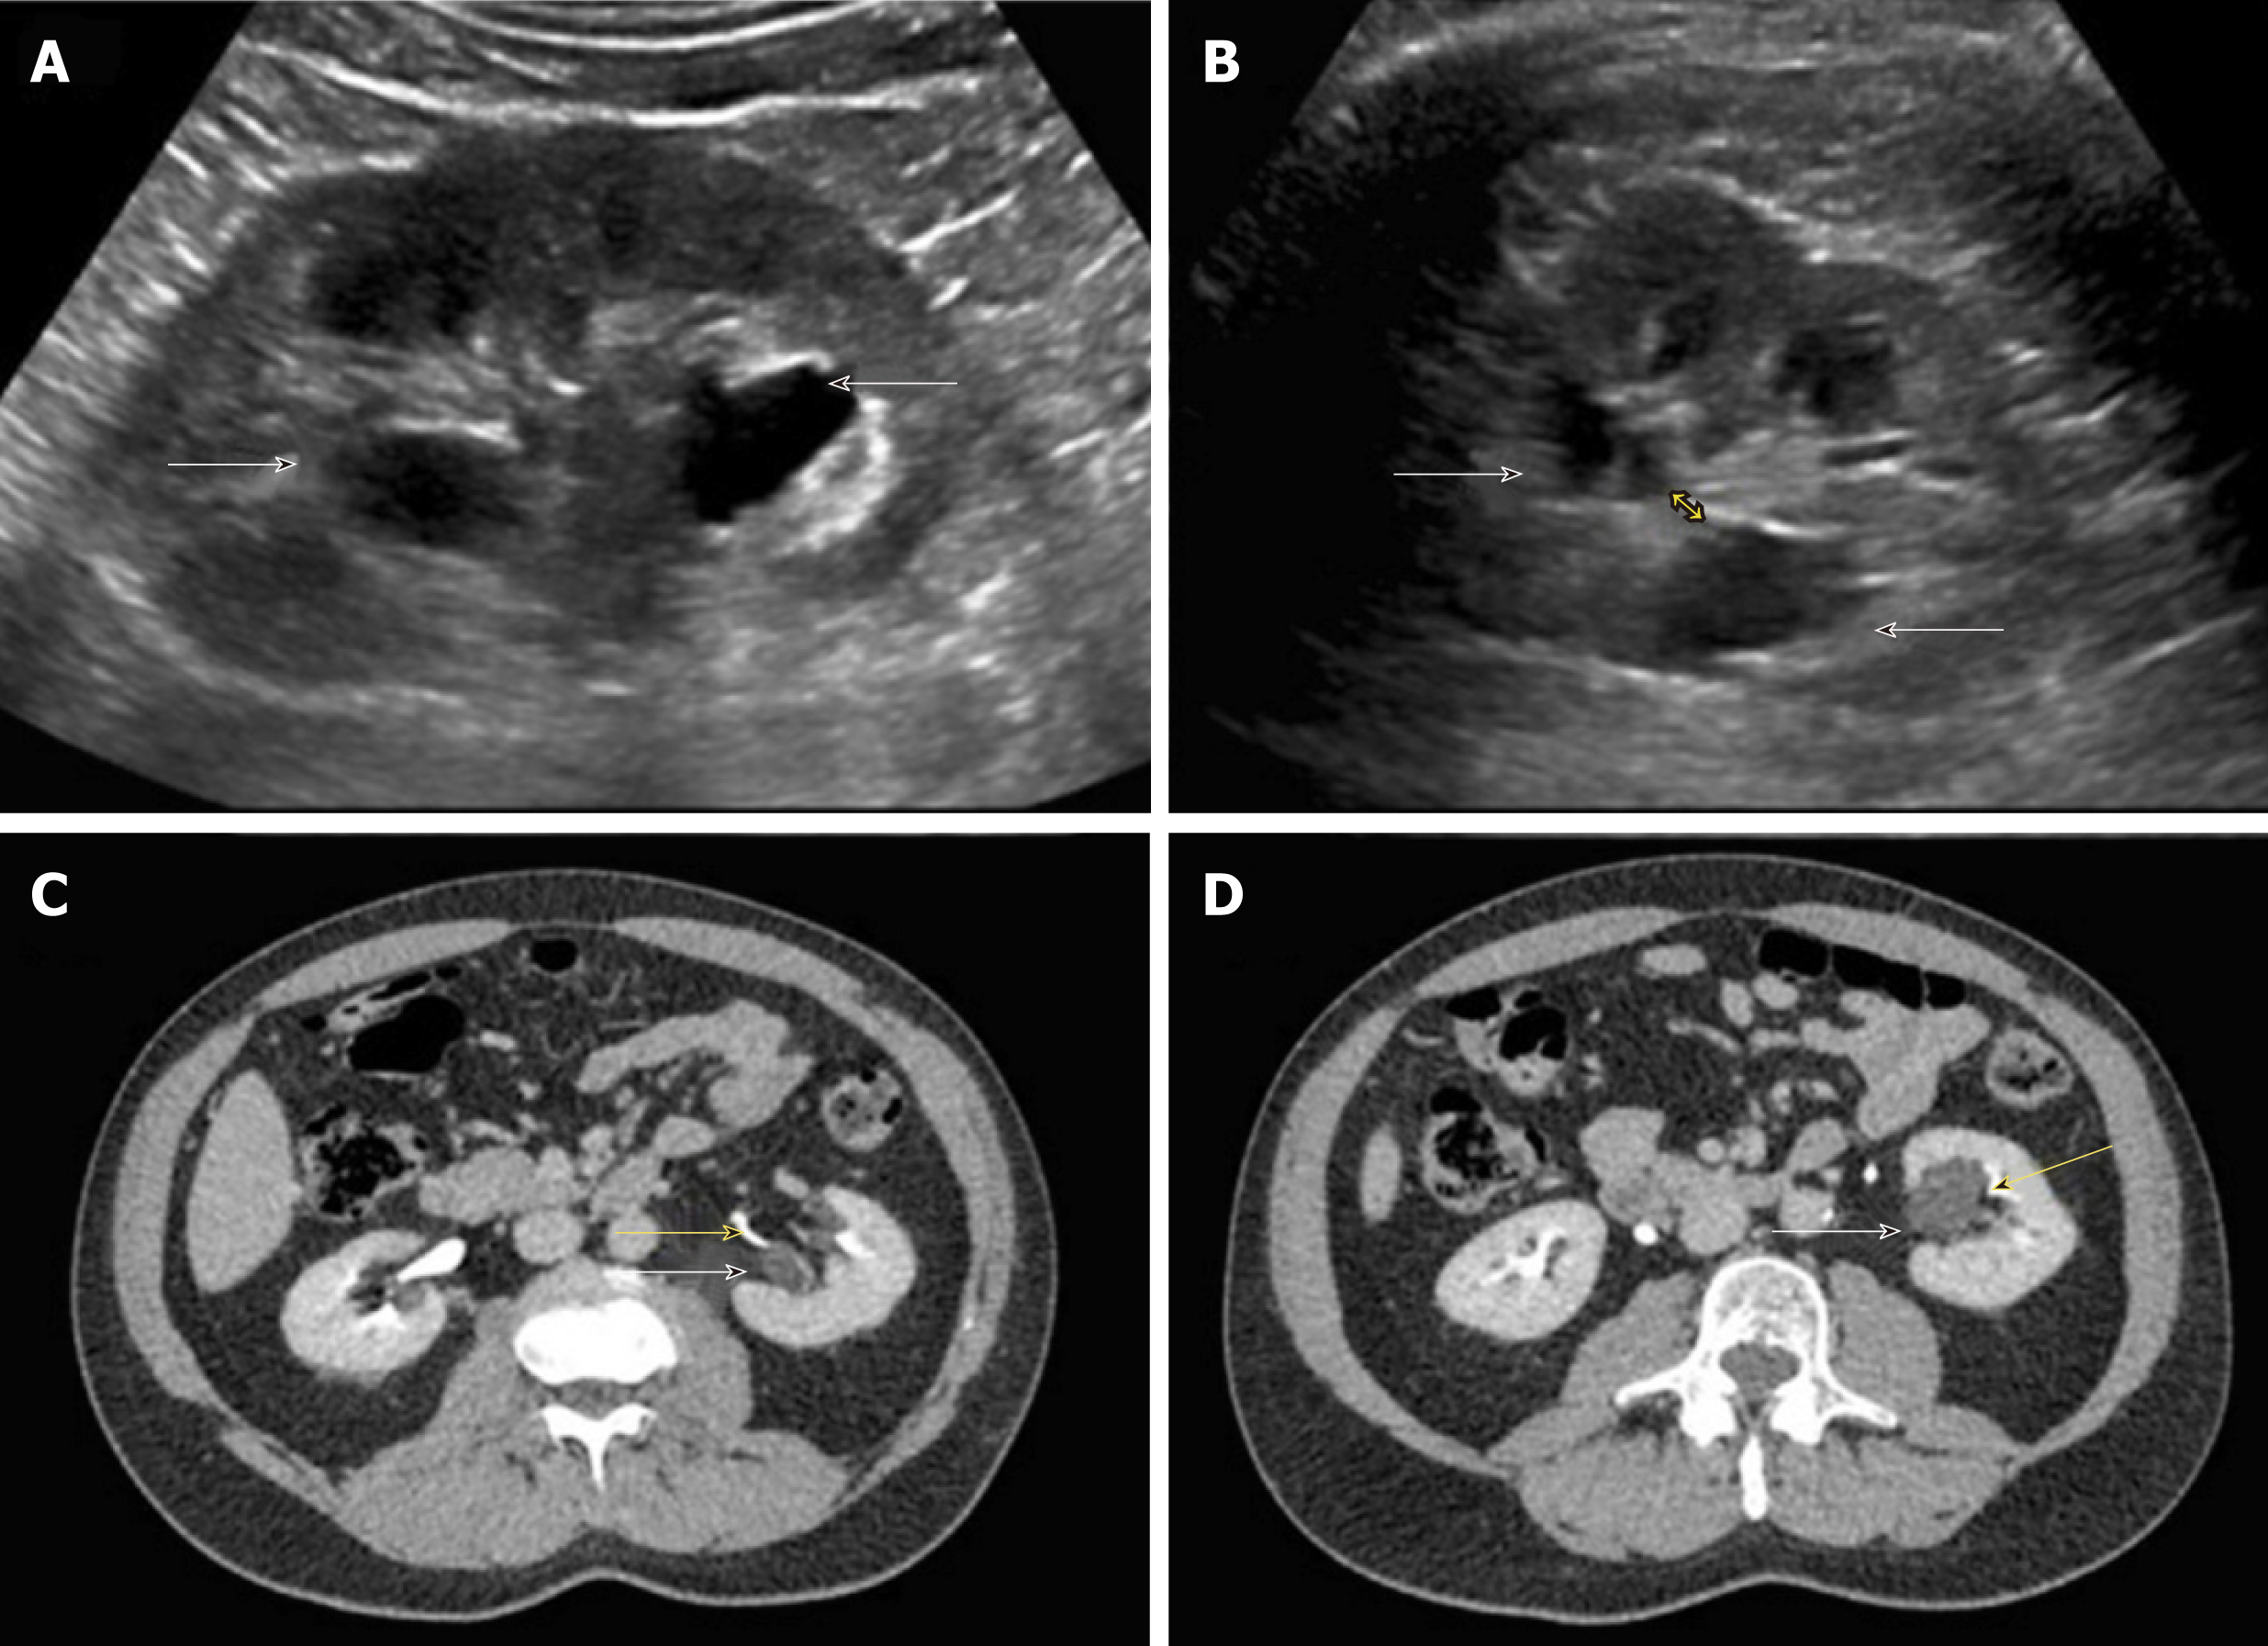
Figure 12 Renal sonogram.
A, B: Sagittal (A) and transverse (B) views of the left kidney showing hypoechoic areas in the pelvic area (arrows) suggestive of hydronephrosis; C, D: However, on the transverse view, these areas do not seem to be connected with one another (double‐headed arrow) and computed tomography (CT) scan with contrast demonstrating (C) and parapelvic cysts (arrows) that are separate from the contrast‐filled collecting system (yellow arrows) (D). Adapted from reference no. 30, first author’s previous work, published under CC BY-NC 4.0 license.
- Citation: Koratala A, Bhattacharya D, Kazory A. Point of care renal ultrasonography for the busy nephrologist: A pictorial review. World J Nephrol 2019; 8(3): 44-58
- URL: https://www.wjgnet.com/2220-6124/full/v8/i3/44.htm
- DOI: https://dx.doi.org/10.5527/wjn.v8.i3.44


