Copyright
©The Author(s) 2017.
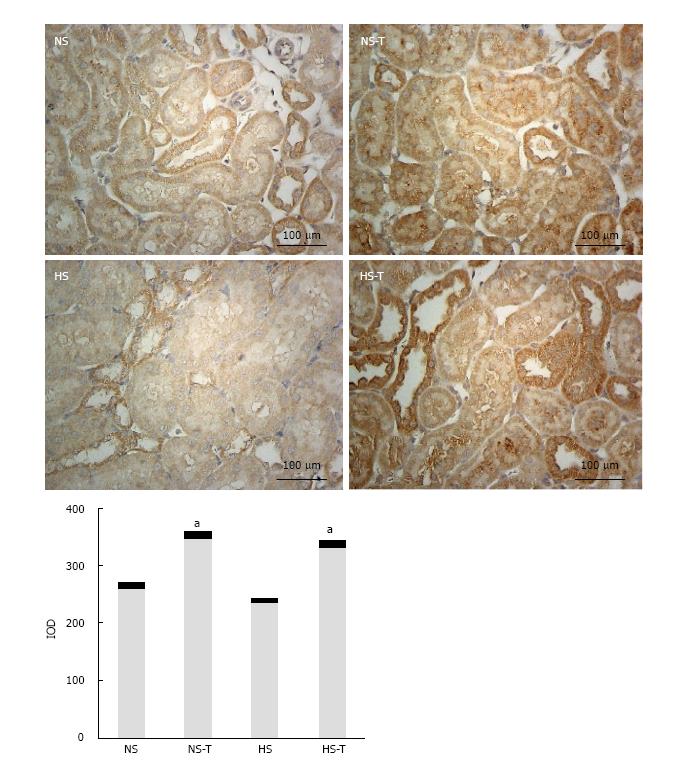
Figure 6 The graphs show the quantitative evaluation of angiotensin type 2 receptor immunostaining in renal tissue.
Data are expressed as mean ± SEM; aP < 0.05 vs the respective group without tempol. The photomicrographs represent AT2R immunostaining in NS, HS, NS-T and HS-T groups. Original magnification: 400 ×. IOD: Integrated optic density; NS: Normal salt diet group; HS: High salt diet group; NS-T: Normal salt diet plus tempol group; HS-T: High salt diet plus tempol group; AT2R: Angiotensin type 2 receptor.
- Citation: Cao G, Della Penna SL, Kouyoumdzian NM, Choi MR, Gorzalczany S, Fernández BE, Toblli JE, Rosón MI. Immunohistochemical expression of intrarenal renin angiotensin system components in response to tempol in rats fed a high salt diet. World J Nephrol 2017; 6(1): 29-40
- URL: https://www.wjgnet.com/2220-6124/full/v6/i1/29.htm
- DOI: https://dx.doi.org/10.5527/wjn.v6.i1.29


