Copyright
©The Author(s) 2017.
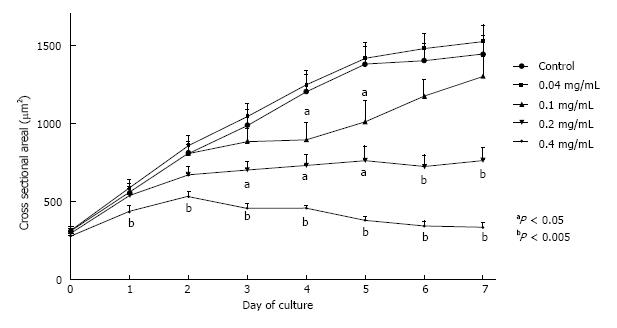
Figure 1 Growth curves for cross section area for acetylsalicylic acid treatments.
Cross-section metanephroi area was used to produce growth curves of individual ASA treatments and their contralateral controls (n = 8-12). Controls are represents together as there were no differences between controls of each treatment group. aP < 0.05, bP < 0.005 denotes statistical differences with control organs. ASA: Acetylsalicylic acid.
- Citation: Welham SJM, Sparrow AJ, Gardner DS, Elmes MJ. Acetylsalicylic acid interferes with embryonic kidney growth and development by a prostaglandin-independent mechanism. World J Nephrol 2017; 6(1): 21-28
- URL: https://www.wjgnet.com/2220-6124/full/v6/i1/21.htm
- DOI: https://dx.doi.org/10.5527/wjn.v6.i1.21


