Copyright
©The Author(s) 2016.
World J Nephrol. Jul 6, 2016; 5(4): 339-357
Published online Jul 6, 2016. doi: 10.5527/wjn.v5.i4.339
Published online Jul 6, 2016. doi: 10.5527/wjn.v5.i4.339
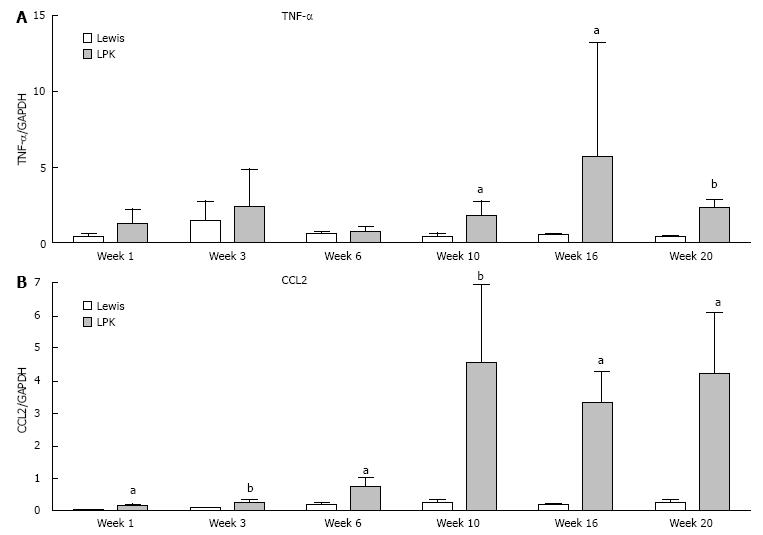
Figure 10 Quantitative polymerase chain reaction data for (A) TNFα and (B) CCL2 in Lewis and Lewis polycystic kidney tissue from weeks 1 to 20.
The mRNA expression is shown as the target gene corrected for GAPDH. aP < 0.05 vs Lewis for the corresponding timepoint; bP < 0.01 vs Lewis for the corresponding timepoint. LPK: Lewis polycystic kidney; TNF: Tumor necrosis factor.
- Citation: Ta MHT, Schwensen KG, Liuwantara D, Huso DL, Watnick T, Rangan GK. Constitutive renal Rel/nuclear factor-κB expression in Lewis polycystic kidney disease rats. World J Nephrol 2016; 5(4): 339-357
- URL: https://www.wjgnet.com/2220-6124/full/v5/i4/339.htm
- DOI: https://dx.doi.org/10.5527/wjn.v5.i4.339


