Copyright
©The Author(s) 2015.
World J Nephrol. Jul 6, 2015; 4(3): 388-395
Published online Jul 6, 2015. doi: 10.5527/wjn.v4.i3.388
Published online Jul 6, 2015. doi: 10.5527/wjn.v4.i3.388
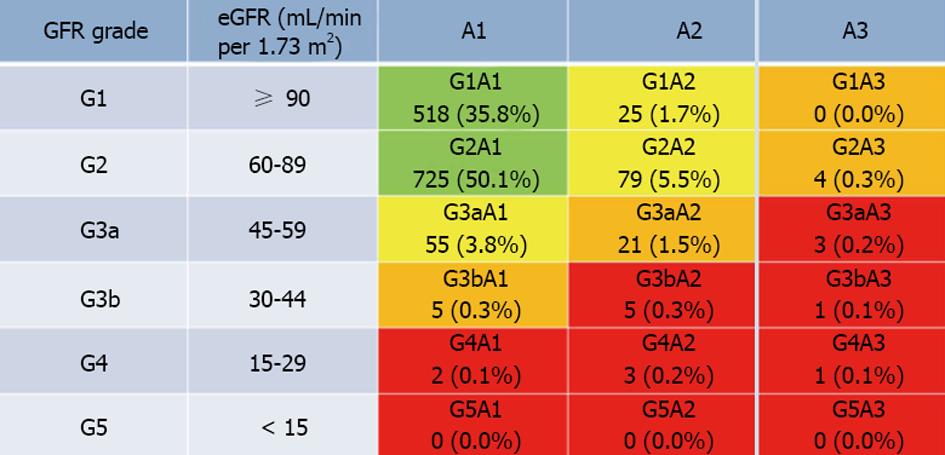
Figure 1 Distribution of human immunodeficiency virus-infected individuals determined by the KDIGO 2012 classification.
The percentage of HIV-infected individuals in each category is expressed in each color box. The cohort includes 1447 HIV-infected patients. The prevalence of individuals in the green, yellow, orange, and red zone was 85.9%, 11.0%, 2.1%, and 1.0%, respectively. KDIGO: Kidney Disease: Outcomes Quality Initiative; CKD: Chronic kidney disease; eGFR: Estimated glomerular filtration rate; A1: No proteinuria (dipstick - or +/-); A2: Mild proteinuria (dipstick 1+ or 2+); A3: Heavy proteinuria (dipstick ≥ 3+); HIV: Human immunodeficiency virus.
- Citation: Ando M, Yanagisawa N. Epidemiology, clinical characteristics, and management of chronic kidney disease in human immunodeficiency virus-infected patients. World J Nephrol 2015; 4(3): 388-395
- URL: https://www.wjgnet.com/2220-6124/full/v4/i3/388.htm
- DOI: https://dx.doi.org/10.5527/wjn.v4.i3.388


