Copyright
©The Author(s) 2015.
World J Nephrol. Jul 6, 2015; 4(3): 330-344
Published online Jul 6, 2015. doi: 10.5527/wjn.v4.i3.330
Published online Jul 6, 2015. doi: 10.5527/wjn.v4.i3.330
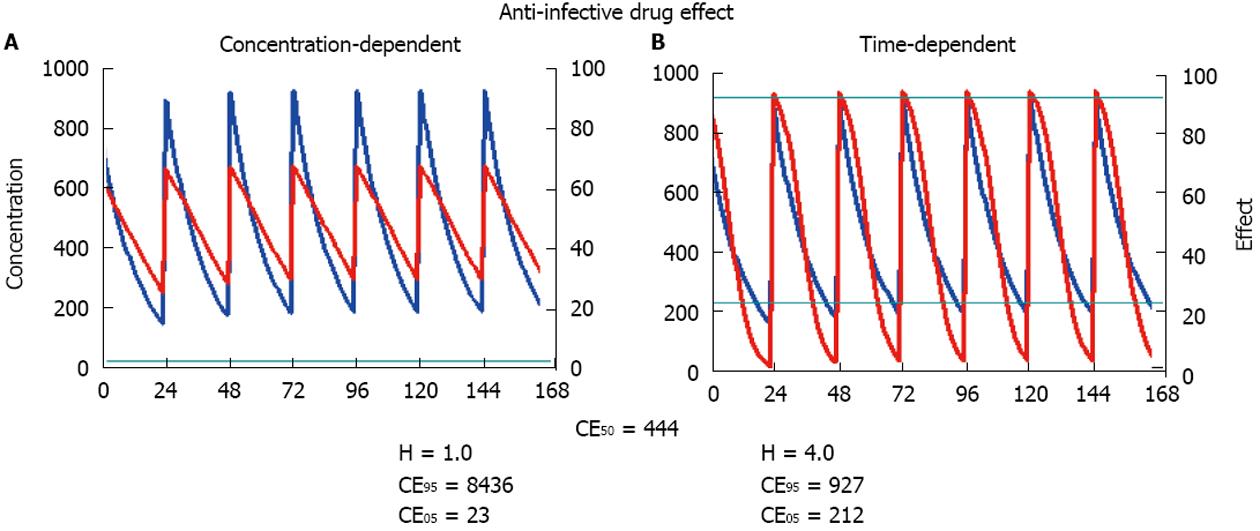
Figure 5 Pharmacodynamics of anti-infective drugs.
The pharmacokinetics and the concentration curves are equal in both diagrams. Also the concentration producing the half-maximum effect is the same but the Hill coefficient is different. A: Concentration-dependent effect: With a Hill coefficient of H = 1.0, the calculated peak effect is only 60% and far from the ceiling effect CE95. Thus, the concentration-dependent effect could be strengthened by increasing the dose; B: Time-dependent effect: With a Hill coefficient of H = 4.0, the calculated trough effect falls below the threshold concentration CE05 at the second part of the administration interval. Thus, the time-dependent effect could be strengthened by dosing more frequently.
- Citation: Keller F, Schröppel B, Ludwig U. Pharmacokinetic and pharmacodynamic considerations of antimicrobial drug therapy in cancer patients with kidney dysfunction. World J Nephrol 2015; 4(3): 330-344
- URL: https://www.wjgnet.com/2220-6124/full/v4/i3/330.htm
- DOI: https://dx.doi.org/10.5527/wjn.v4.i3.330


