Copyright
©The Author(s) 2015.
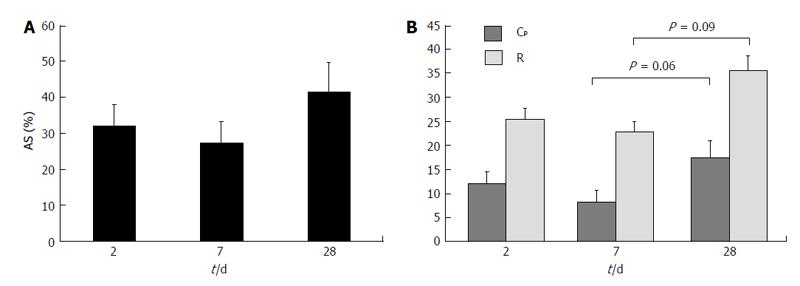
Figure 8 Variation of (A) percentage area stenosis and (B) pressure drop coef-ficient and resistance index over time for arteriovenous fistulas created in a pig model[70].
AS: Area stenosis; Cp: Pressure drop coefficient; R: Resistance index. The t/d in the x axis stands for time (days). © 2014, Copyright the Authors. Artificial Organs, © 2014 International Center for Artificial Organs and Transplantation and Wiley Periodicals, Inc.
- Citation: Rajabi-Jaghargh E, Banerjee RK. Combined functional and anatomical diagnostic endpoints for assessing arteriovenous fistula dysfunction. World J Nephrol 2015; 4(1): 6-18
- URL: https://www.wjgnet.com/2220-6124/full/v4/i1/6.htm
- DOI: https://dx.doi.org/10.5527/wjn.v4.i1.6


