Copyright
©2014 Baishideng Publishing Group Inc.
World J Nephrol. Nov 6, 2014; 3(4): 256-267
Published online Nov 6, 2014. doi: 10.5527/wjn.v3.i4.256
Published online Nov 6, 2014. doi: 10.5527/wjn.v3.i4.256
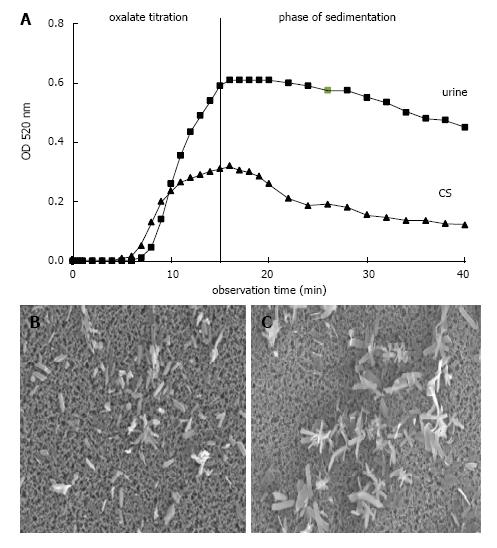
Figure 6 Ox titration.
A: Spectrophotometric crystallization curve of Ox titration (0.1 mmol/min.) in urine and control solution (CS) both with pH 6.0, 100 mmol/L NaCl, initially 2 mmol/L Ca2+ and with total 1.5 mmol/L Ox addition by titration; B: Scanning microscopy of deposit on Millipore filter obtained at the end of Ox titration from urine and (C) from CS.
- Citation: Baumann JM, Affolter B. From crystalluria to kidney stones, some physicochemical aspects of calcium nephrolithiasis. World J Nephrol 2014; 3(4): 256-267
- URL: https://www.wjgnet.com/2220-6124/full/v3/i4/256.htm
- DOI: https://dx.doi.org/10.5527/wjn.v3.i4.256


