Copyright
©2014 Baishideng Publishing Group Inc.
World J Nephrol. Nov 6, 2014; 3(4): 256-267
Published online Nov 6, 2014. doi: 10.5527/wjn.v3.i4.256
Published online Nov 6, 2014. doi: 10.5527/wjn.v3.i4.256
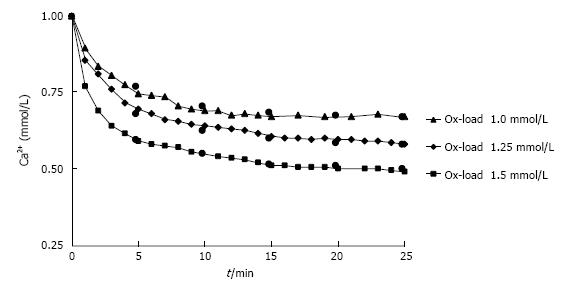
Figure 5 Decrease of Ca2+ in urine during observation time (t) after different Ox additions (1.
0-1.5 mmol/L). Measured (triangle/diamond/square) and by RDt (see text) calculated values (black circle).
- Citation: Baumann JM, Affolter B. From crystalluria to kidney stones, some physicochemical aspects of calcium nephrolithiasis. World J Nephrol 2014; 3(4): 256-267
- URL: https://www.wjgnet.com/2220-6124/full/v3/i4/256.htm
- DOI: https://dx.doi.org/10.5527/wjn.v3.i4.256


