Copyright
©2014 Baishideng Publishing Group Inc.
World J Nephrol. Nov 6, 2014; 3(4): 122-142
Published online Nov 6, 2014. doi: 10.5527/wjn.v3.i4.122
Published online Nov 6, 2014. doi: 10.5527/wjn.v3.i4.122
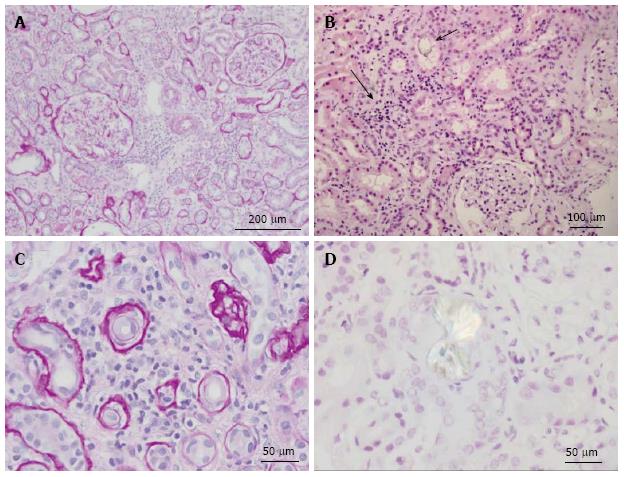
Figure 3 Renal histology in the patient depicted in Figure 2.
A: Low power view of kidney showing two complete glomeruli and expansion of the interstitium by lymphocytes and edema. Periodic acid-Schiff (PAS) stain highlights the basement membranes of the tubules and Bowman’s capsule. PAS stain; B: Low power view of renal parenchyma showing tubulointerstitial nephritis (solid arrow) and oxalate crystal within tubule (open arrow). H and E stain; C: High power view showing interstitium expanded by lymphocytic infiltrates and tubular atrophy. PAS stain; D: High power view of calcium oxalate crystal under polarized light. H and E stain.
- Citation: Glew RH, Sun Y, Horowitz BL, Konstantinov KN, Barry M, Fair JR, Massie L, Tzamaloukas AH. Nephropathy in dietary hyperoxaluria: A potentially preventable acute or chronic kidney disease. World J Nephrol 2014; 3(4): 122-142
- URL: https://www.wjgnet.com/2220-6124/full/v3/i4/122.htm
- DOI: https://dx.doi.org/10.5527/wjn.v3.i4.122


