Copyright
©The Author(s) 2025.
World J Nephrol. Mar 25, 2025; 14(1): 99044
Published online Mar 25, 2025. doi: 10.5527/wjn.v14.i1.99044
Published online Mar 25, 2025. doi: 10.5527/wjn.v14.i1.99044
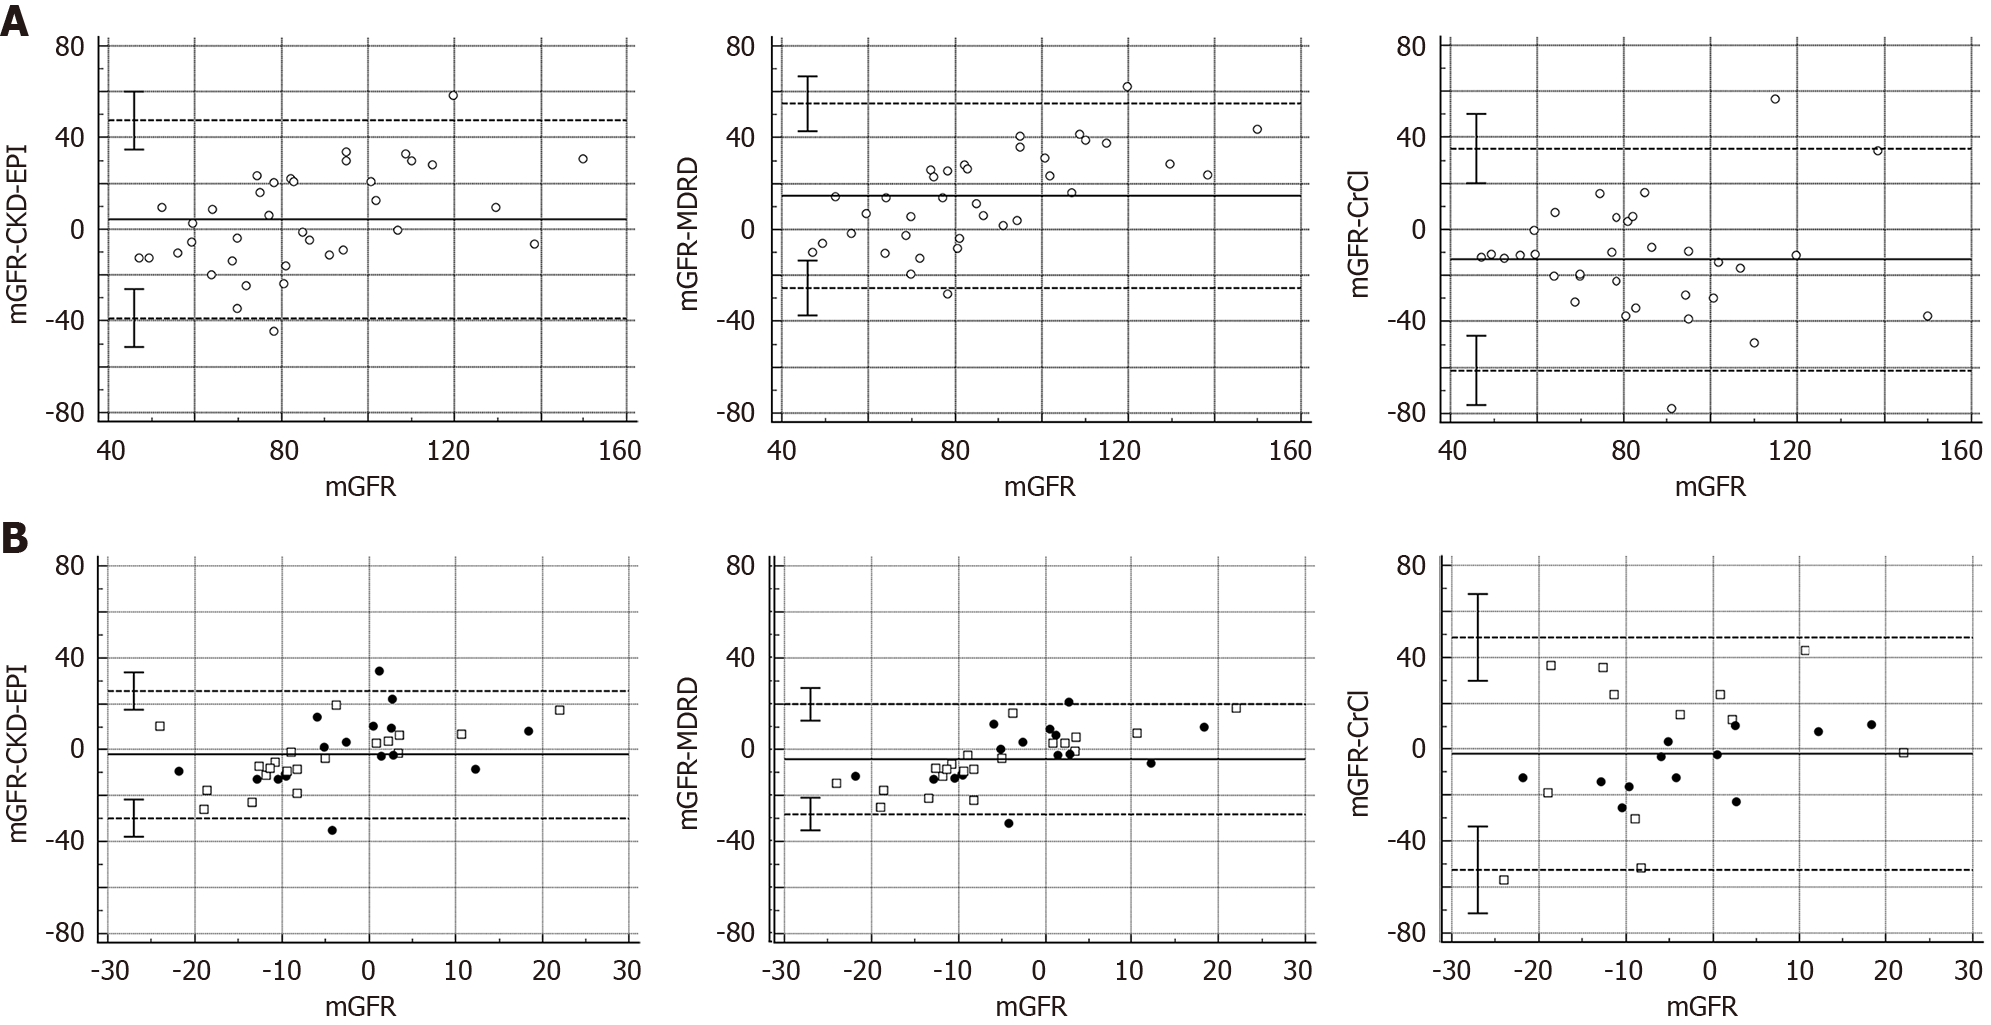
Figure 2 Bland-Almant plot of study sample.
A: Bland-Almant plot of study sample comparing the measured glomerular filtration rate (mGFR) and the estimated glomerular filtrataion rate (eGFR) assessed by different formulas; B: Bland-Almant plot of study sample comparing the changes between baseline and month-6 mGFR and the eGFR assessed by different formulas. The mean score is plotted on the x-axis, and the difference between observers (mean of the differences) is plotted on the y-axis (mean difference ± 1.96 SD). Dark circles represent the patients with a baseline mGFR ≤ 80 mL/minute. The empty squares represent the patients with a baseline mGFR > 80 mL/minute. mGFR: Measured glomerular filtration rate.
- Citation: Fernandez JM, Rodriguez-Pérez JC, Lorenzo-Medina MM, Rodriguez-Esparragon F, Quevedo-Reina JC, Hernandez-Socorro CR. Longitudinal assessment of measured and estimated glomerular filtration-rate in autosomal dominant polycystic kidney disease: Real practice experience. World J Nephrol 2025; 14(1): 99044
- URL: https://www.wjgnet.com/2220-6124/full/v14/i1/99044.htm
- DOI: https://dx.doi.org/10.5527/wjn.v14.i1.99044


