Copyright
©The Author(s) 2024.
World J Nephrol. Sep 25, 2024; 13(3): 95627
Published online Sep 25, 2024. doi: 10.5527/wjn.v13.i3.95627
Published online Sep 25, 2024. doi: 10.5527/wjn.v13.i3.95627
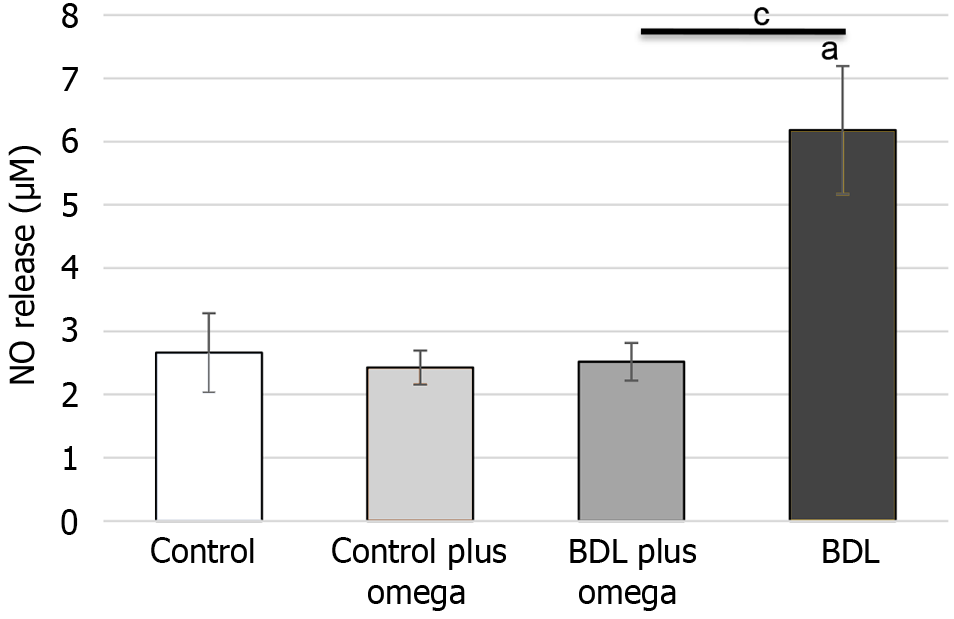
Figure 6 In vivo effects of omega-3 on nitric oxide production.
Values represent the mean ± SD of n = 6 animals per group. aP ≤ 0.001 versus control group, cP ≤ 0.001 versus BDL with BDL plus omega group. BDL: Bile duct ligation; NO: Nitric oxide.
- Citation: Duailibe JBB, Viau CM, Saffi J, Fernandes SA, Porawski M. Protective effect of long-chain polyunsaturated fatty acids on hepatorenal syndrome in rats. World J Nephrol 2024; 13(3): 95627
- URL: https://www.wjgnet.com/2220-6124/full/v13/i3/95627.htm
- DOI: https://dx.doi.org/10.5527/wjn.v13.i3.95627


