Copyright
©The Author(s) 2017.
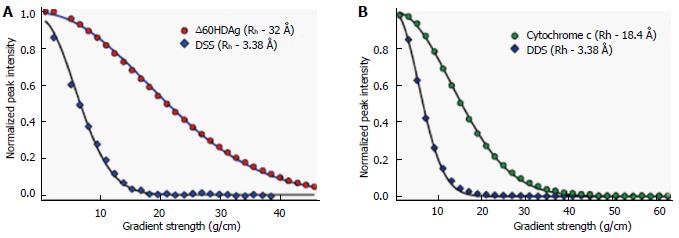
Figure 5 Nuclear magnetic resonance pulsed-field gradient diffusion measurements.
A: NMR PFG diffusion measurements of ∆60HDAg, performed on a Bruker 600 MHz Avance II. DSS (4,4-dimethyl-4-silapentane-1-sulfonic acid) was used as a reference. 1H pulse gradient stimulated echo longitudinal encode-decode (PG-SLED) experiment with saturation of the water signal during the relaxation delay was used with a Bruker pulse sequence: Ledbpgppr2s, at 25 °C. A 14-ppm 1H spectral width was used. Gradient strength varied linearly from 0.963-45.7 g/cm. Solid line represents the result of fitting the experimental data to the diffusion equation (see methods); B: NMR PFG diffusion measurements of cytochrome c, previously measured on a Bruker DMX 600 MHz at 25 °C. NMR: Nuclear magnetic resonance; PFG: Pulsed-field gradient.
- Citation: Alves C, Cheng H, Tavanez JP, Casaca A, Gudima S, Roder H, Cunha C. Structural and nucleic acid binding properties of hepatitis delta virus small antigen. World J Virol 2017; 6(2): 26-35
- URL: https://www.wjgnet.com/2220-3249/full/v6/i2/26.htm
- DOI: https://dx.doi.org/10.5501/wjv.v6.i2.26


