Copyright
©The Author(s) 2017.
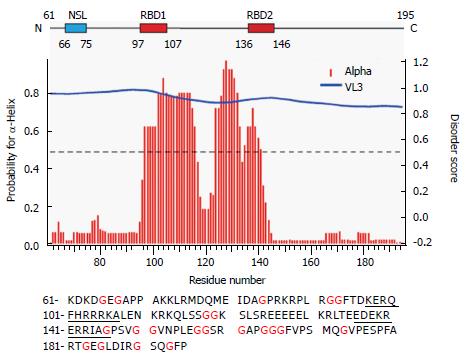
Figure 1 Primary and secondary structure features of Δ60HDAg.
Upper panel displays a schematic representation of Δ60HDAg. NLS is the nuclear localization signal from amino acids 66 to 75 (Alves et al, 2008); RBD corresponds to the RNA binding domain comprised within amino acids 97 and 146 (Lazinski and Taylor, 1993). Middle panel shows the secondary structure prediction and disorder prediction using the meta-predictor PONDR-Fit (http://www.disprot.org/predictors.php), and one of its component programs (VL3) as indicated. The blue line corresponds to the estimated disorder score and red bars indicate the probability of acquisition of α-helix conformation. Bottom panel is the amino acid sequence of Δ60HDAg. The underlined amino acid residues correspond to the RBD. Isoelectric point of Δ60HDAg’s is 9.8 and molecular weight is 14.8 kDa, estimated by using Expasy (http://www.expasy.org).
- Citation: Alves C, Cheng H, Tavanez JP, Casaca A, Gudima S, Roder H, Cunha C. Structural and nucleic acid binding properties of hepatitis delta virus small antigen. World J Virol 2017; 6(2): 26-35
- URL: https://www.wjgnet.com/2220-3249/full/v6/i2/26.htm
- DOI: https://dx.doi.org/10.5501/wjv.v6.i2.26


