Copyright
©2014 Baishideng Publishing Group Inc.
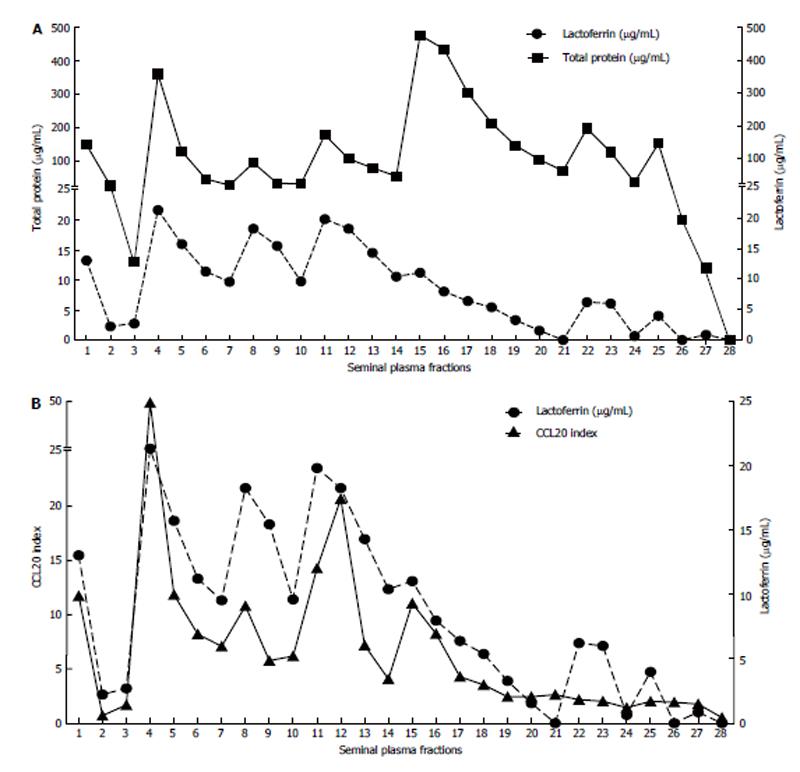
Figure 3 Fractionation by ion exchange chromatography of pooled seminal plasma specimens from 12 human immunodeficiency virus-seronegative subjects.
A: Total protein (upper curve) and lactoferrin (lower curve) concentrations, expressed in μg/mL, in each fraction; B: Correlation between the CCL20 index after stimulation of HEC-1A cells by each fraction (closed squares) and its concentration in lactoferrin expressed in μg/mL (closed circles).
- Citation: Lourenço AG, Komesu MC, Machado AA, Quintana SM, Bourlet T, Pozzetto B, Delézay O. Semen lactoferrin promotes CCL20 production by epithelial cells: Involvement in HIV transmission. World J Virol 2014; 3(2): 11-17
- URL: https://www.wjgnet.com/2220-3249/full/v3/i2/11.htm
- DOI: https://dx.doi.org/10.5501/wjv.v3.i2.11


