Copyright
©The Author(s) 2023.
World J Virol. Sep 25, 2023; 12(4): 233-241
Published online Sep 25, 2023. doi: 10.5501/wjv.v12.i4.233
Published online Sep 25, 2023. doi: 10.5501/wjv.v12.i4.233
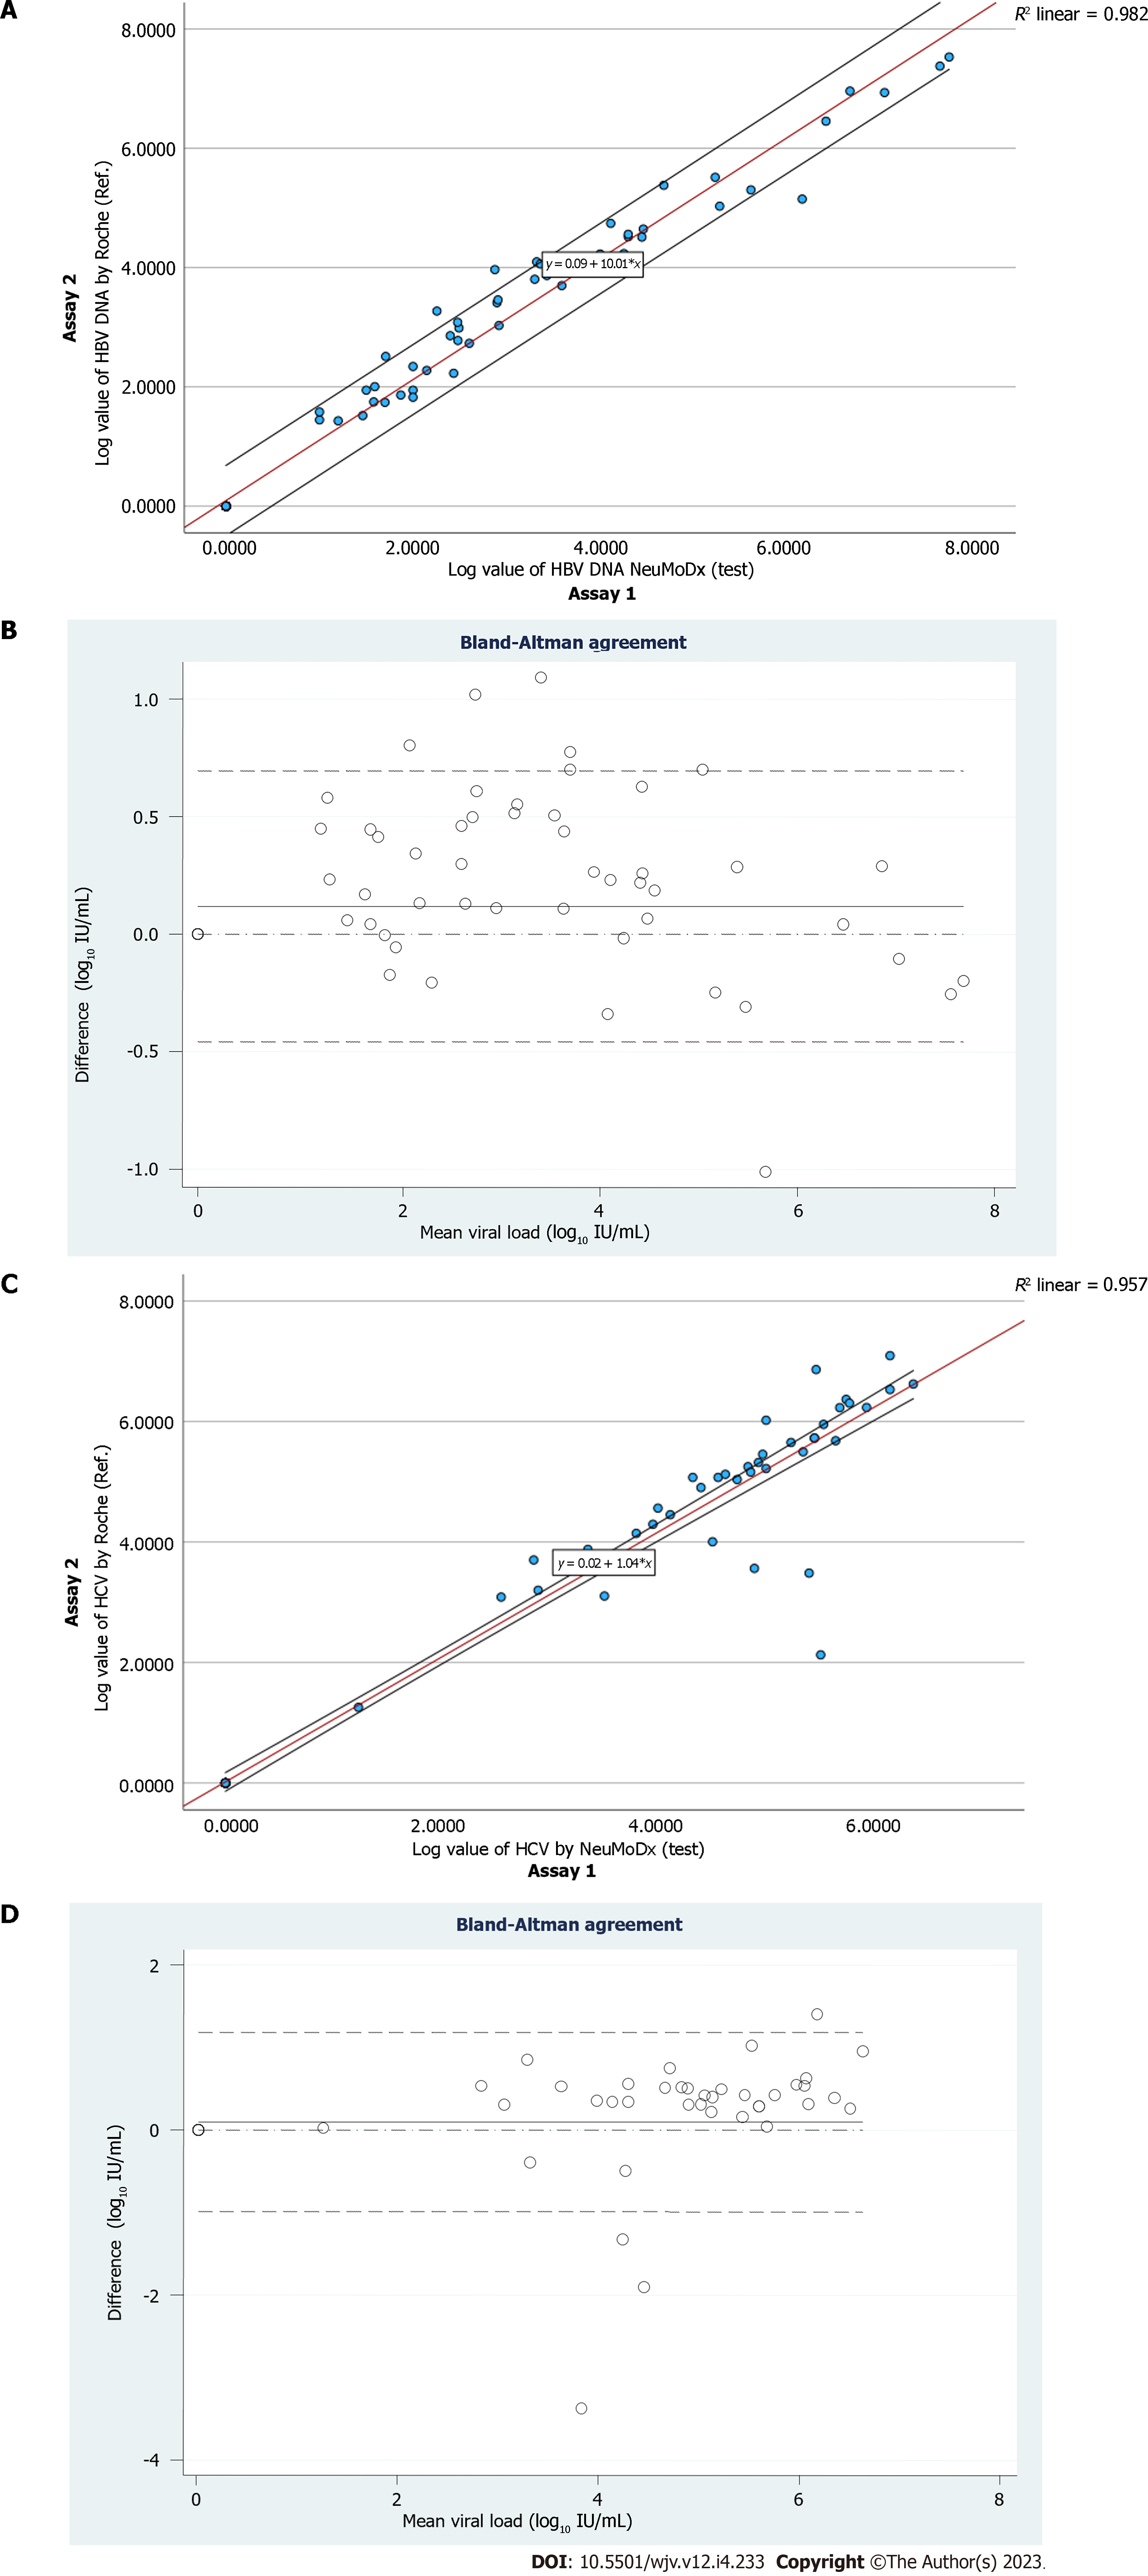
Figure 1 Linear regression analysis and Bland-Altman plot.
A: Linear regression analysis for correlation of hepatitis B virus (HBV) viral load between assay 1 and assay 2; B: Bland-Altman plot for comparison of HBV viral load between assay 1 and assay 2; C: Linear regression analysis for correlation of hepatitis C virus (HCV) viral load between assay 1 and assay 2; D: Bland-Altman plot for comparison of HCV viral load between assay 1 and assay 2.
- Citation: Chooramani G, Samal J, Rani N, Singh G, Agarwal R, Bajpai M, Kumar M, Prasad M, Gupta E. Performance evaluation of NeuMoDx 96 system for hepatitis B and C viral load. World J Virol 2023; 12(4): 233-241
- URL: https://www.wjgnet.com/2220-3249/full/v12/i4/233.htm
- DOI: https://dx.doi.org/10.5501/wjv.v12.i4.233


