Copyright
©The Author(s) 2022.
World J Virol. Sep 25, 2022; 11(5): 331-340
Published online Sep 25, 2022. doi: 10.5501/wjv.v11.i5.331
Published online Sep 25, 2022. doi: 10.5501/wjv.v11.i5.331
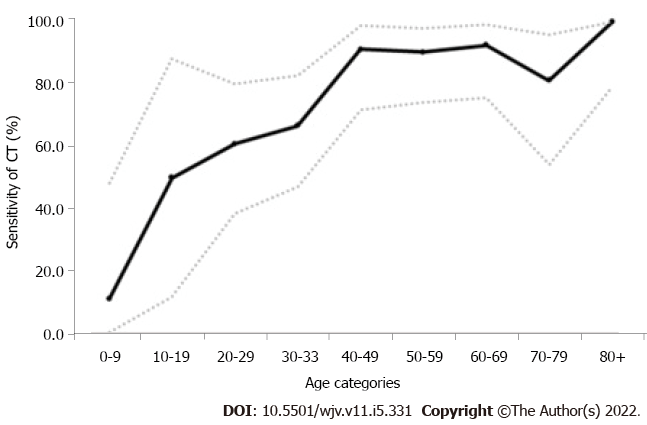
Figure 3 Sensitivity of computed tomography by age groups.
Sensitivity values and their 95% confidence intervals were shown on the graph. CT: Computed tomography.
- Citation: Karavas E, Unver E, Aydın S, Yalcin GS, Fatihoglu E, Kuyrukluyildiz U, Arslan YK, Yazici M. Effect of age on computed tomography findings: Specificity and sensitivity in coronavirus disease 2019 infection. World J Virol 2022; 11(5): 331-340
- URL: https://www.wjgnet.com/2220-3249/full/v11/i5/331.htm
- DOI: https://dx.doi.org/10.5501/wjv.v11.i5.331


