Copyright
©The Author(s) 2024.
World J Virol. Mar 25, 2024; 13(1): 88164
Published online Mar 25, 2024. doi: 10.5501/wjv.v13.i1.88164
Published online Mar 25, 2024. doi: 10.5501/wjv.v13.i1.88164
Figure 1 Entropy plot of aligned whole-genome sequences using BioEdit software.
Arrows indicate the lowest variability regions used for locating conserved amplicons for each type of virus. HCV: Hepatitis C virus; HBV: Hepatitis B virus; HIV-1: Human immunodeficiency virus 1.
Figure 2 Screenshot of AutoDimer output evaluating all selected polymerase chain reaction primers for dimer and hairpin formations (score number = 4).
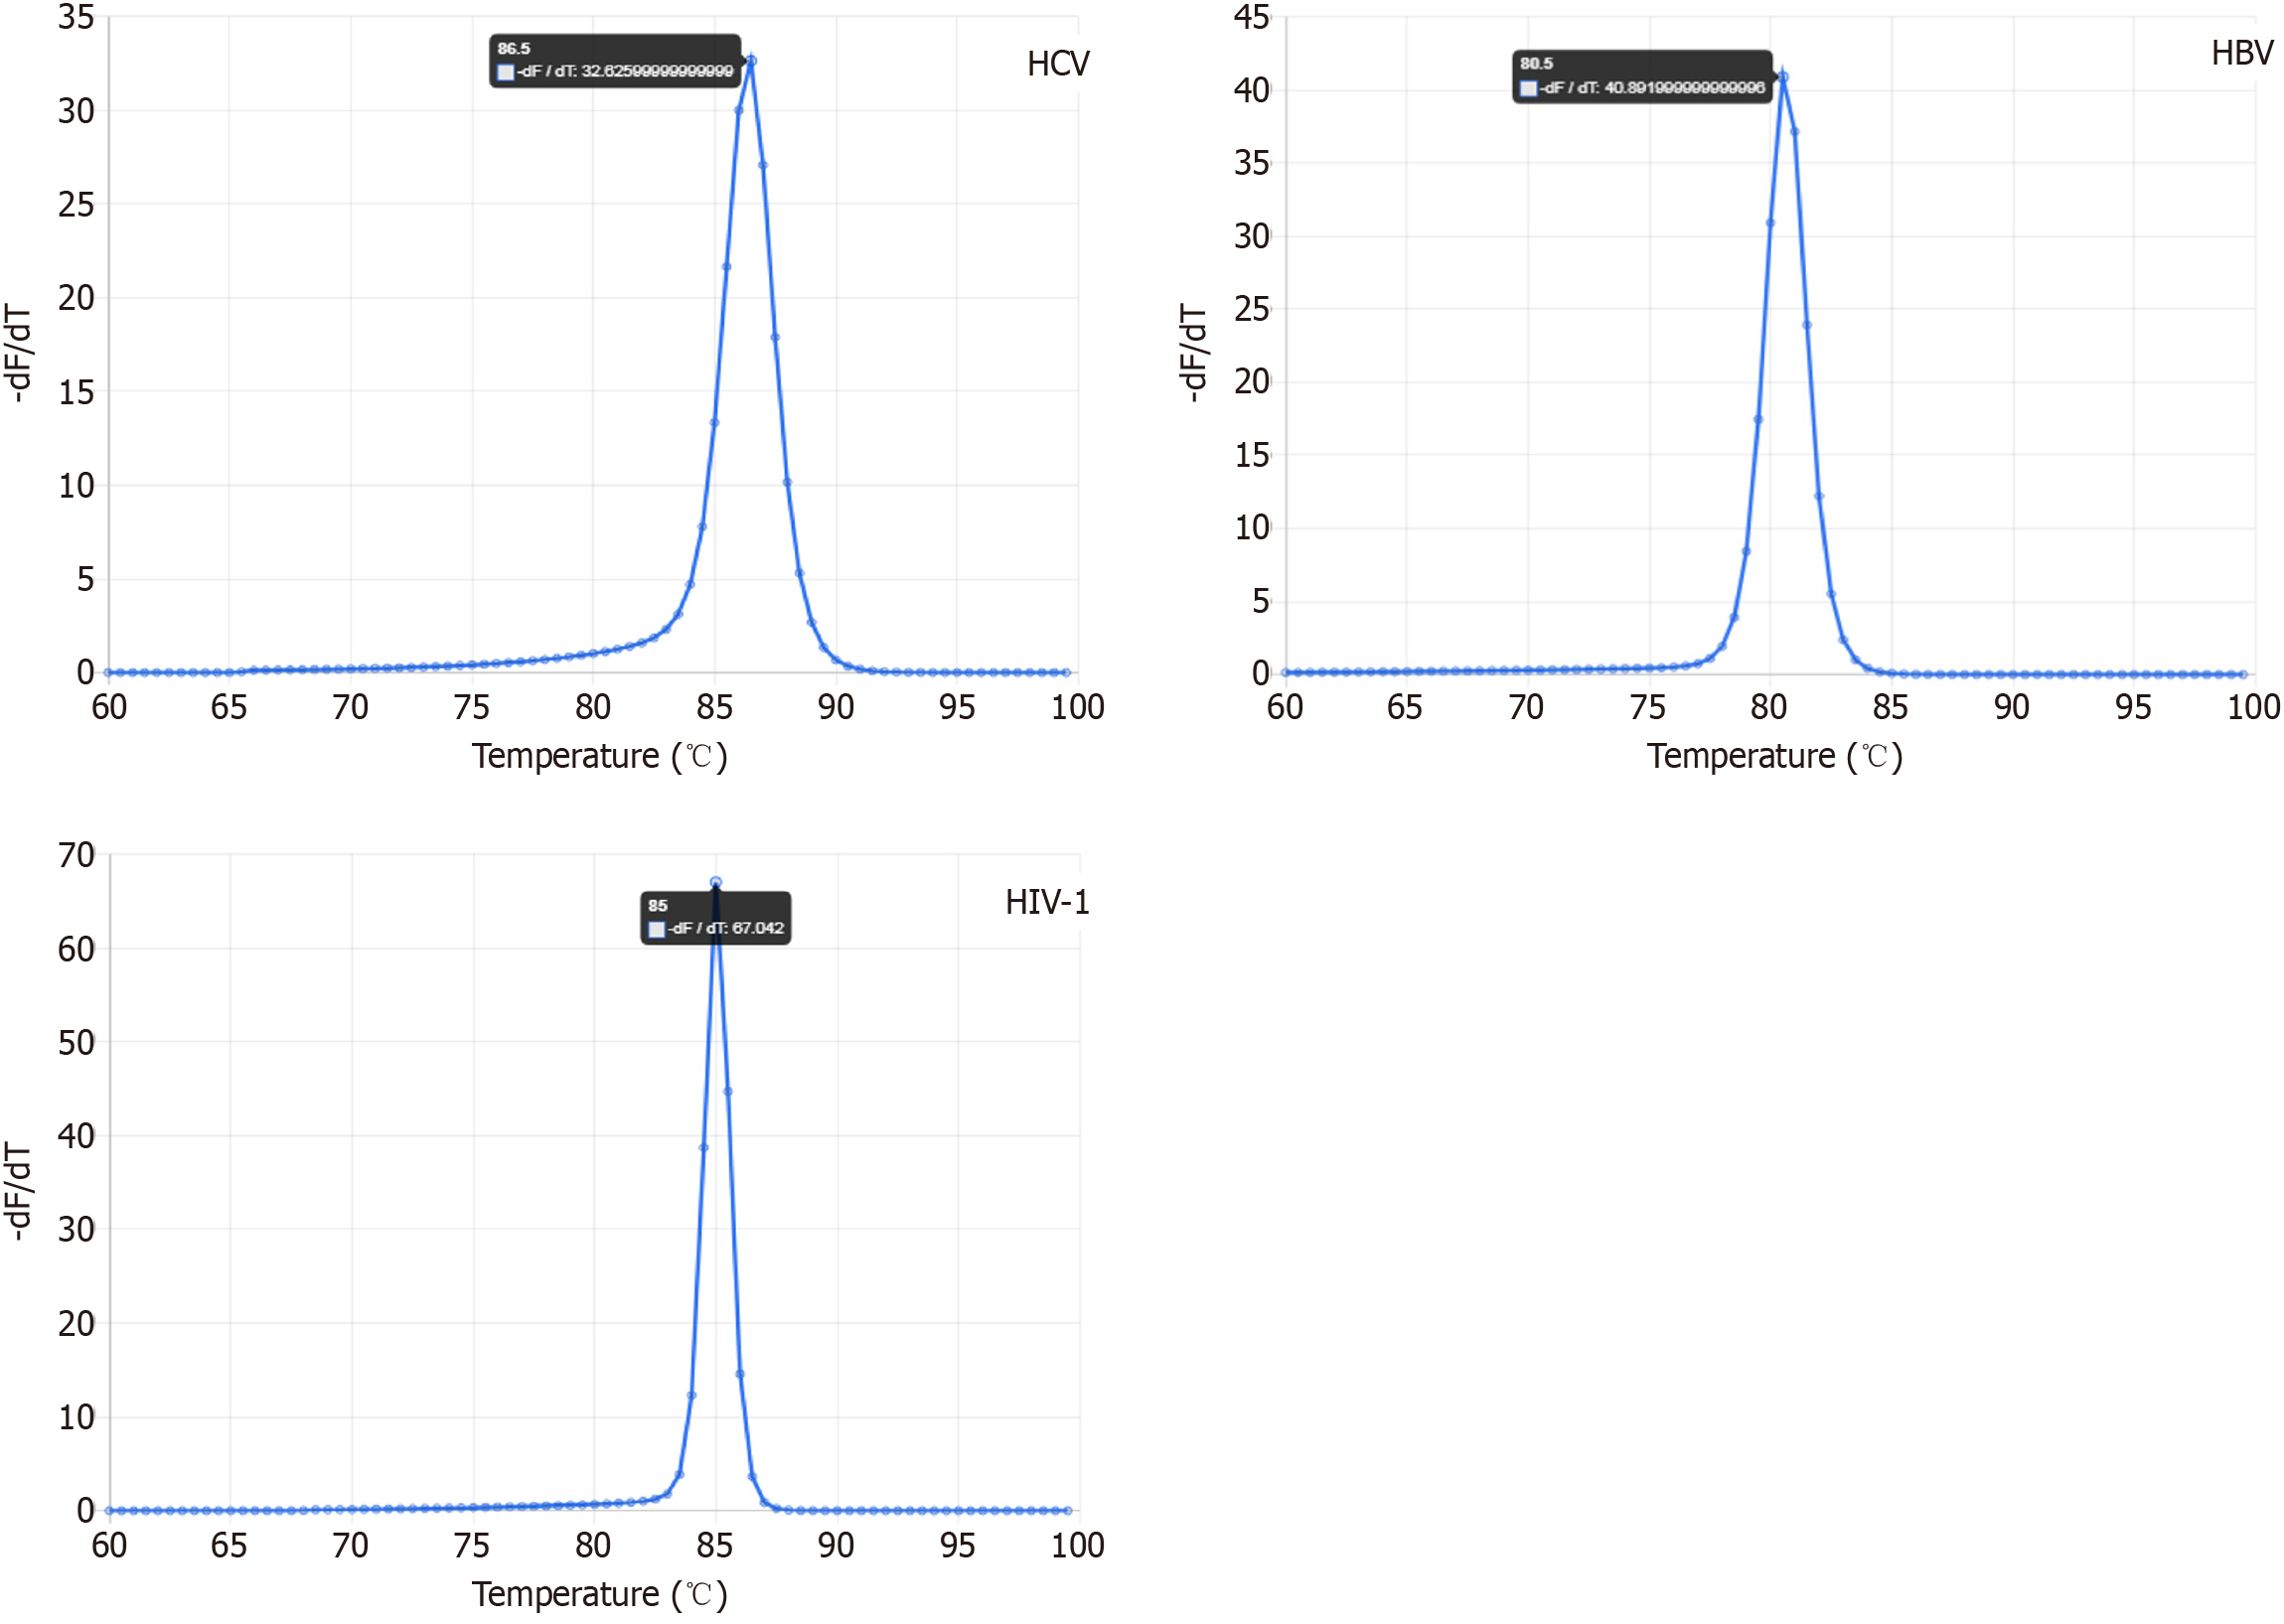
Figure 3 Screenshots of predicted melting profiles of hepatitis C virus, hepatitis B virus, and human immunodeficiency virus 1 amplicons using the uMELT web-based tool.
HCV: Hepatitis C virus; HBV: Hepatitis B virus; HIV-1: Human immunodeficiency virus 1.
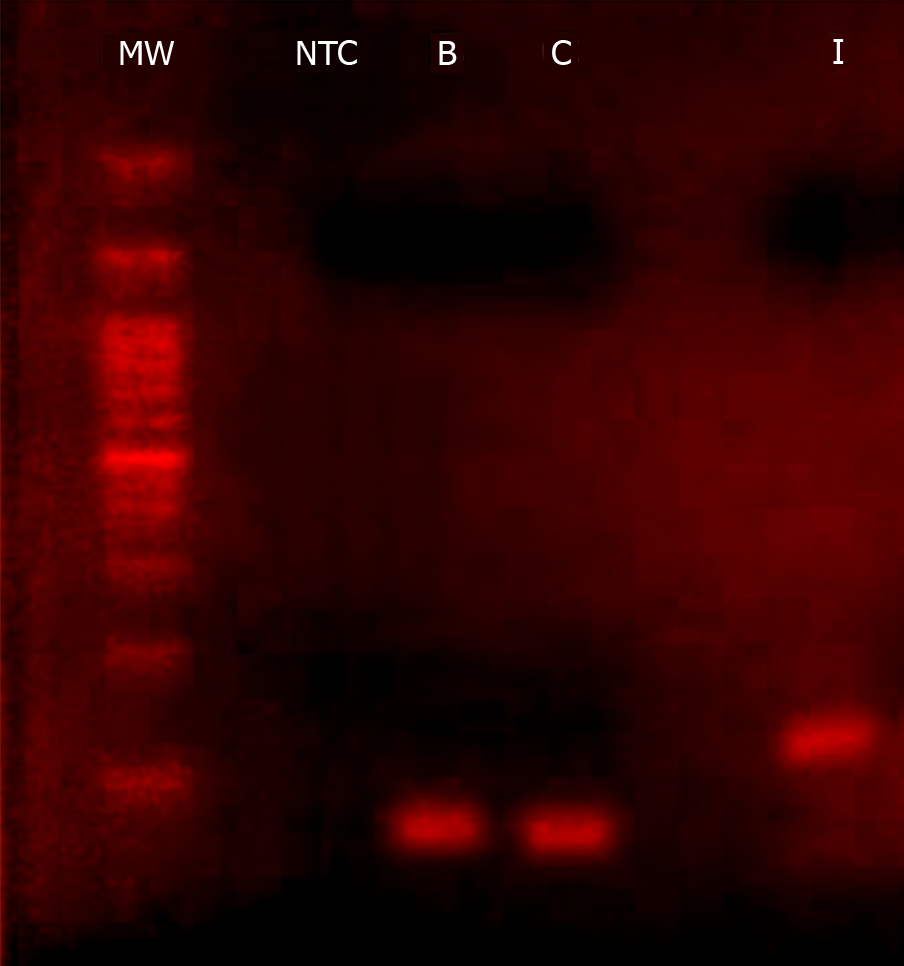
Figure 4 Agarose gel electrophoresis photograph of migrated polymerase chain reaction products for hepatitis B virus (B), hepatitis C virus (C), and human immunodeficiency virus 1 (I).
The amplification was done using a triplex primers set. The lane indicated by (MW) was loaded with 100-bp DNA ladder, and NTC indicates the no-template control sample. Agarose gel was made at a concentration of 2% (W/V) of molecular screening agarose (Roche Diagnostics GmbH).
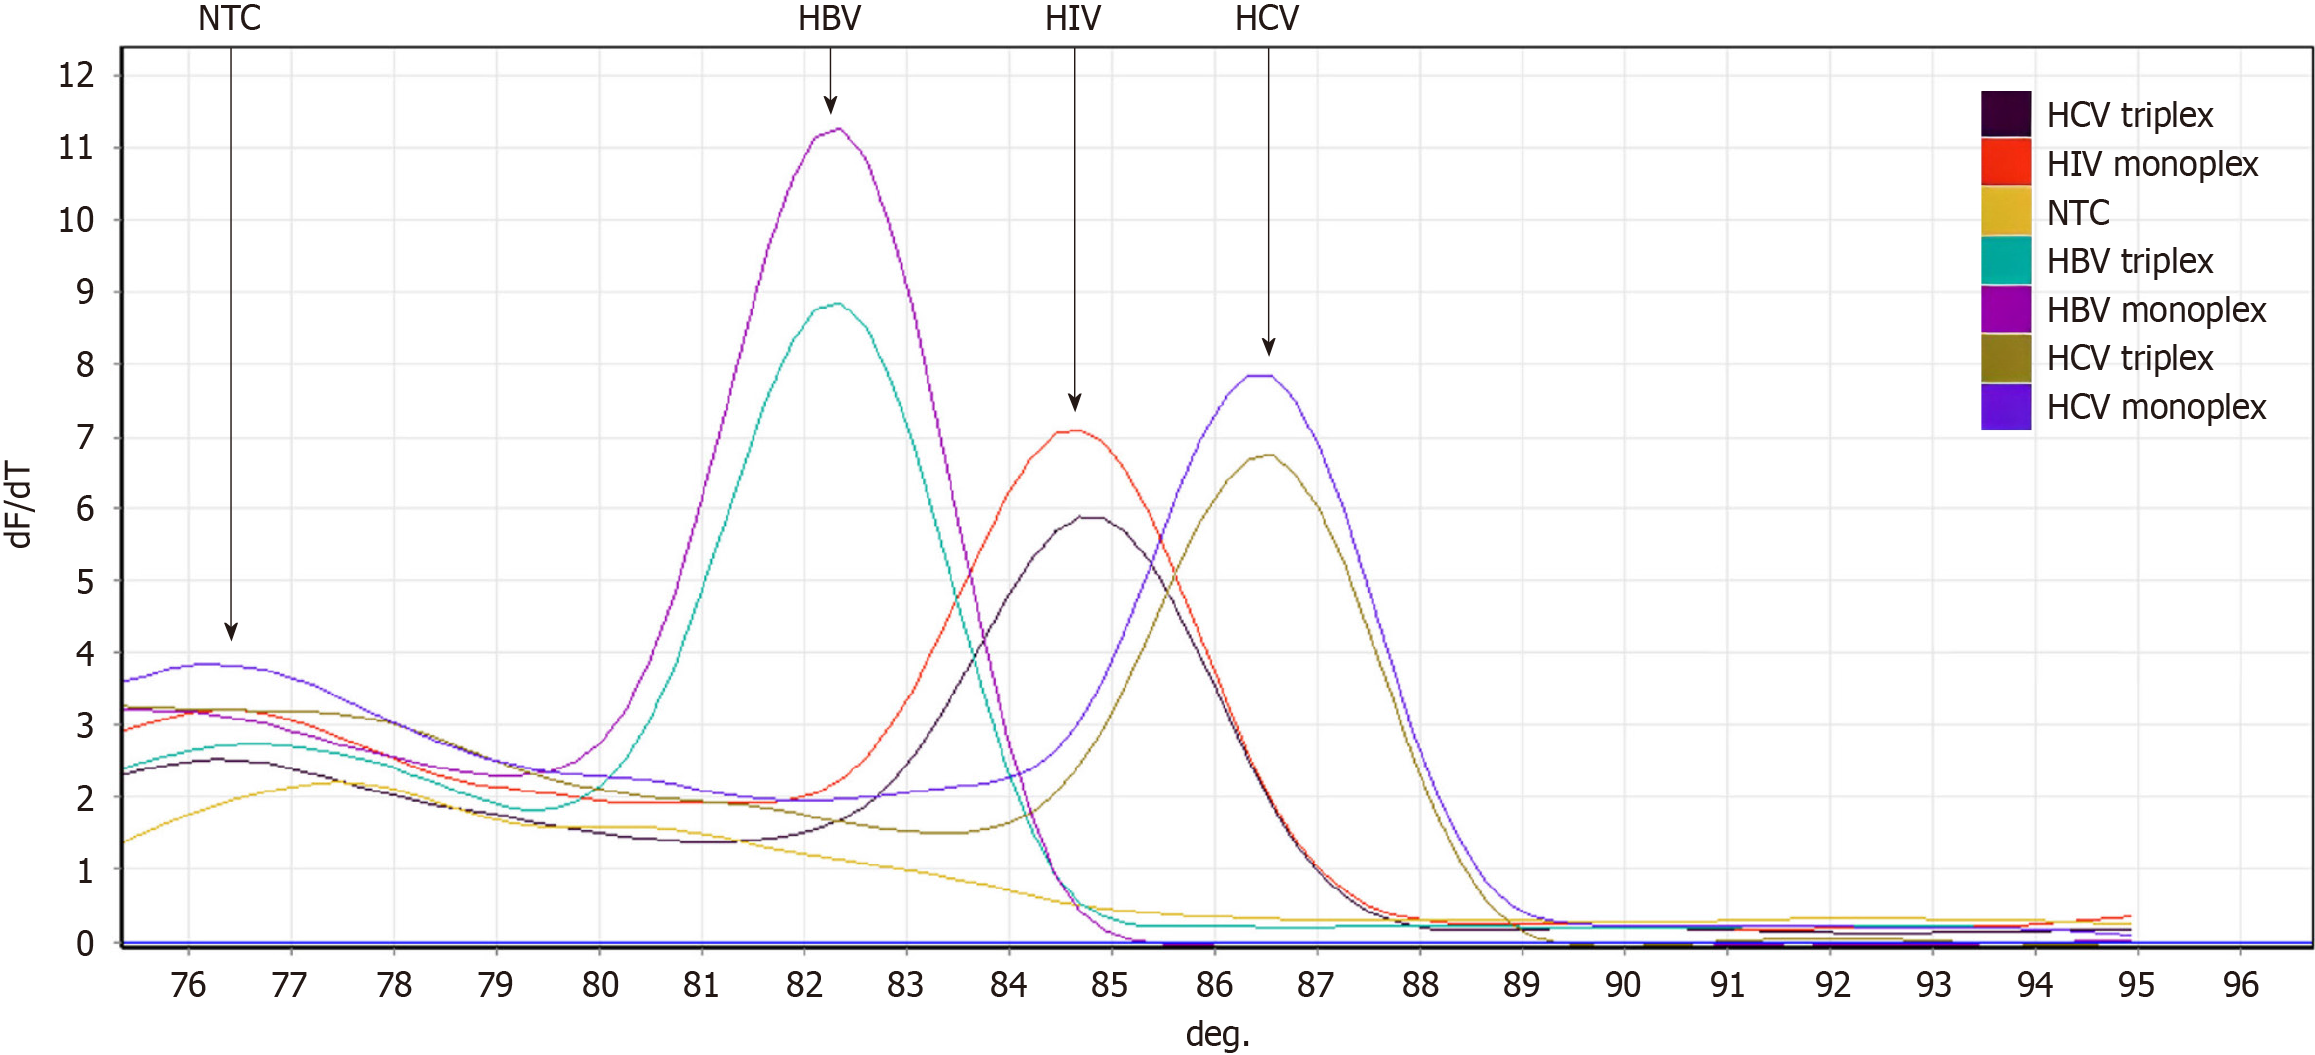
Figure 5 End-point analysis of monoplex and triplex polymerase chain reactions using high-resolution melting which differentiated between hepatitis C virus, hepatitis B virus, and human immunodeficiency virus 1 amplicons according to the melt profile.
HCV: Hepatitis C virus; HBV: Hepatitis B virus; HIV-1: Human immunodeficiency virus 1; NTC: No template control.
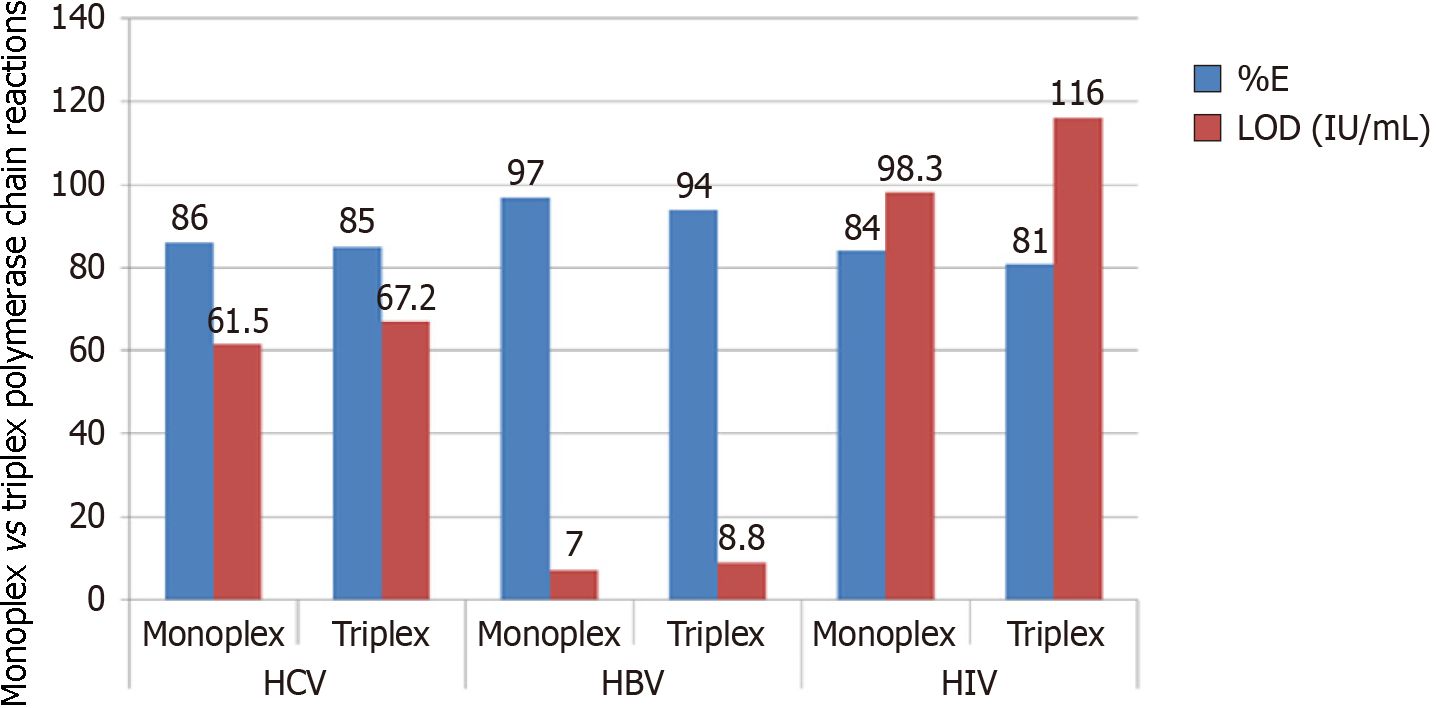
Figure 6 Amplification efficiency and limit of detection of monoplex vs triplex polymerase chain reactions targeting hepatitis C virus, hepatitis B virus, and human immunodeficiency virus 1 genomes.
HCV: Hepatitis C virus; HBV: Hepatitis B virus; HIV-1: Human immunodeficiency virus 1; LOD: Limit of detection.
- Citation: Nemr WA, Nashwa RK. Development of a multiplex polymerase chain reaction assay for detection of hepatitis C virus, hepatitis B virus, and human immunodeficiency virus 1. World J Virol 2024; 13(1): 88164
- URL: https://www.wjgnet.com/2220-3249/full/v13/i1/88164.htm
- DOI: https://dx.doi.org/10.5501/wjv.v13.i1.88164


