Copyright
©The Author(s) 2019.
World J Transplant. Oct 28, 2019; 9(6): 134-144
Published online Oct 28, 2019. doi: 10.5500/wjt.v9.i6.134
Published online Oct 28, 2019. doi: 10.5500/wjt.v9.i6.134
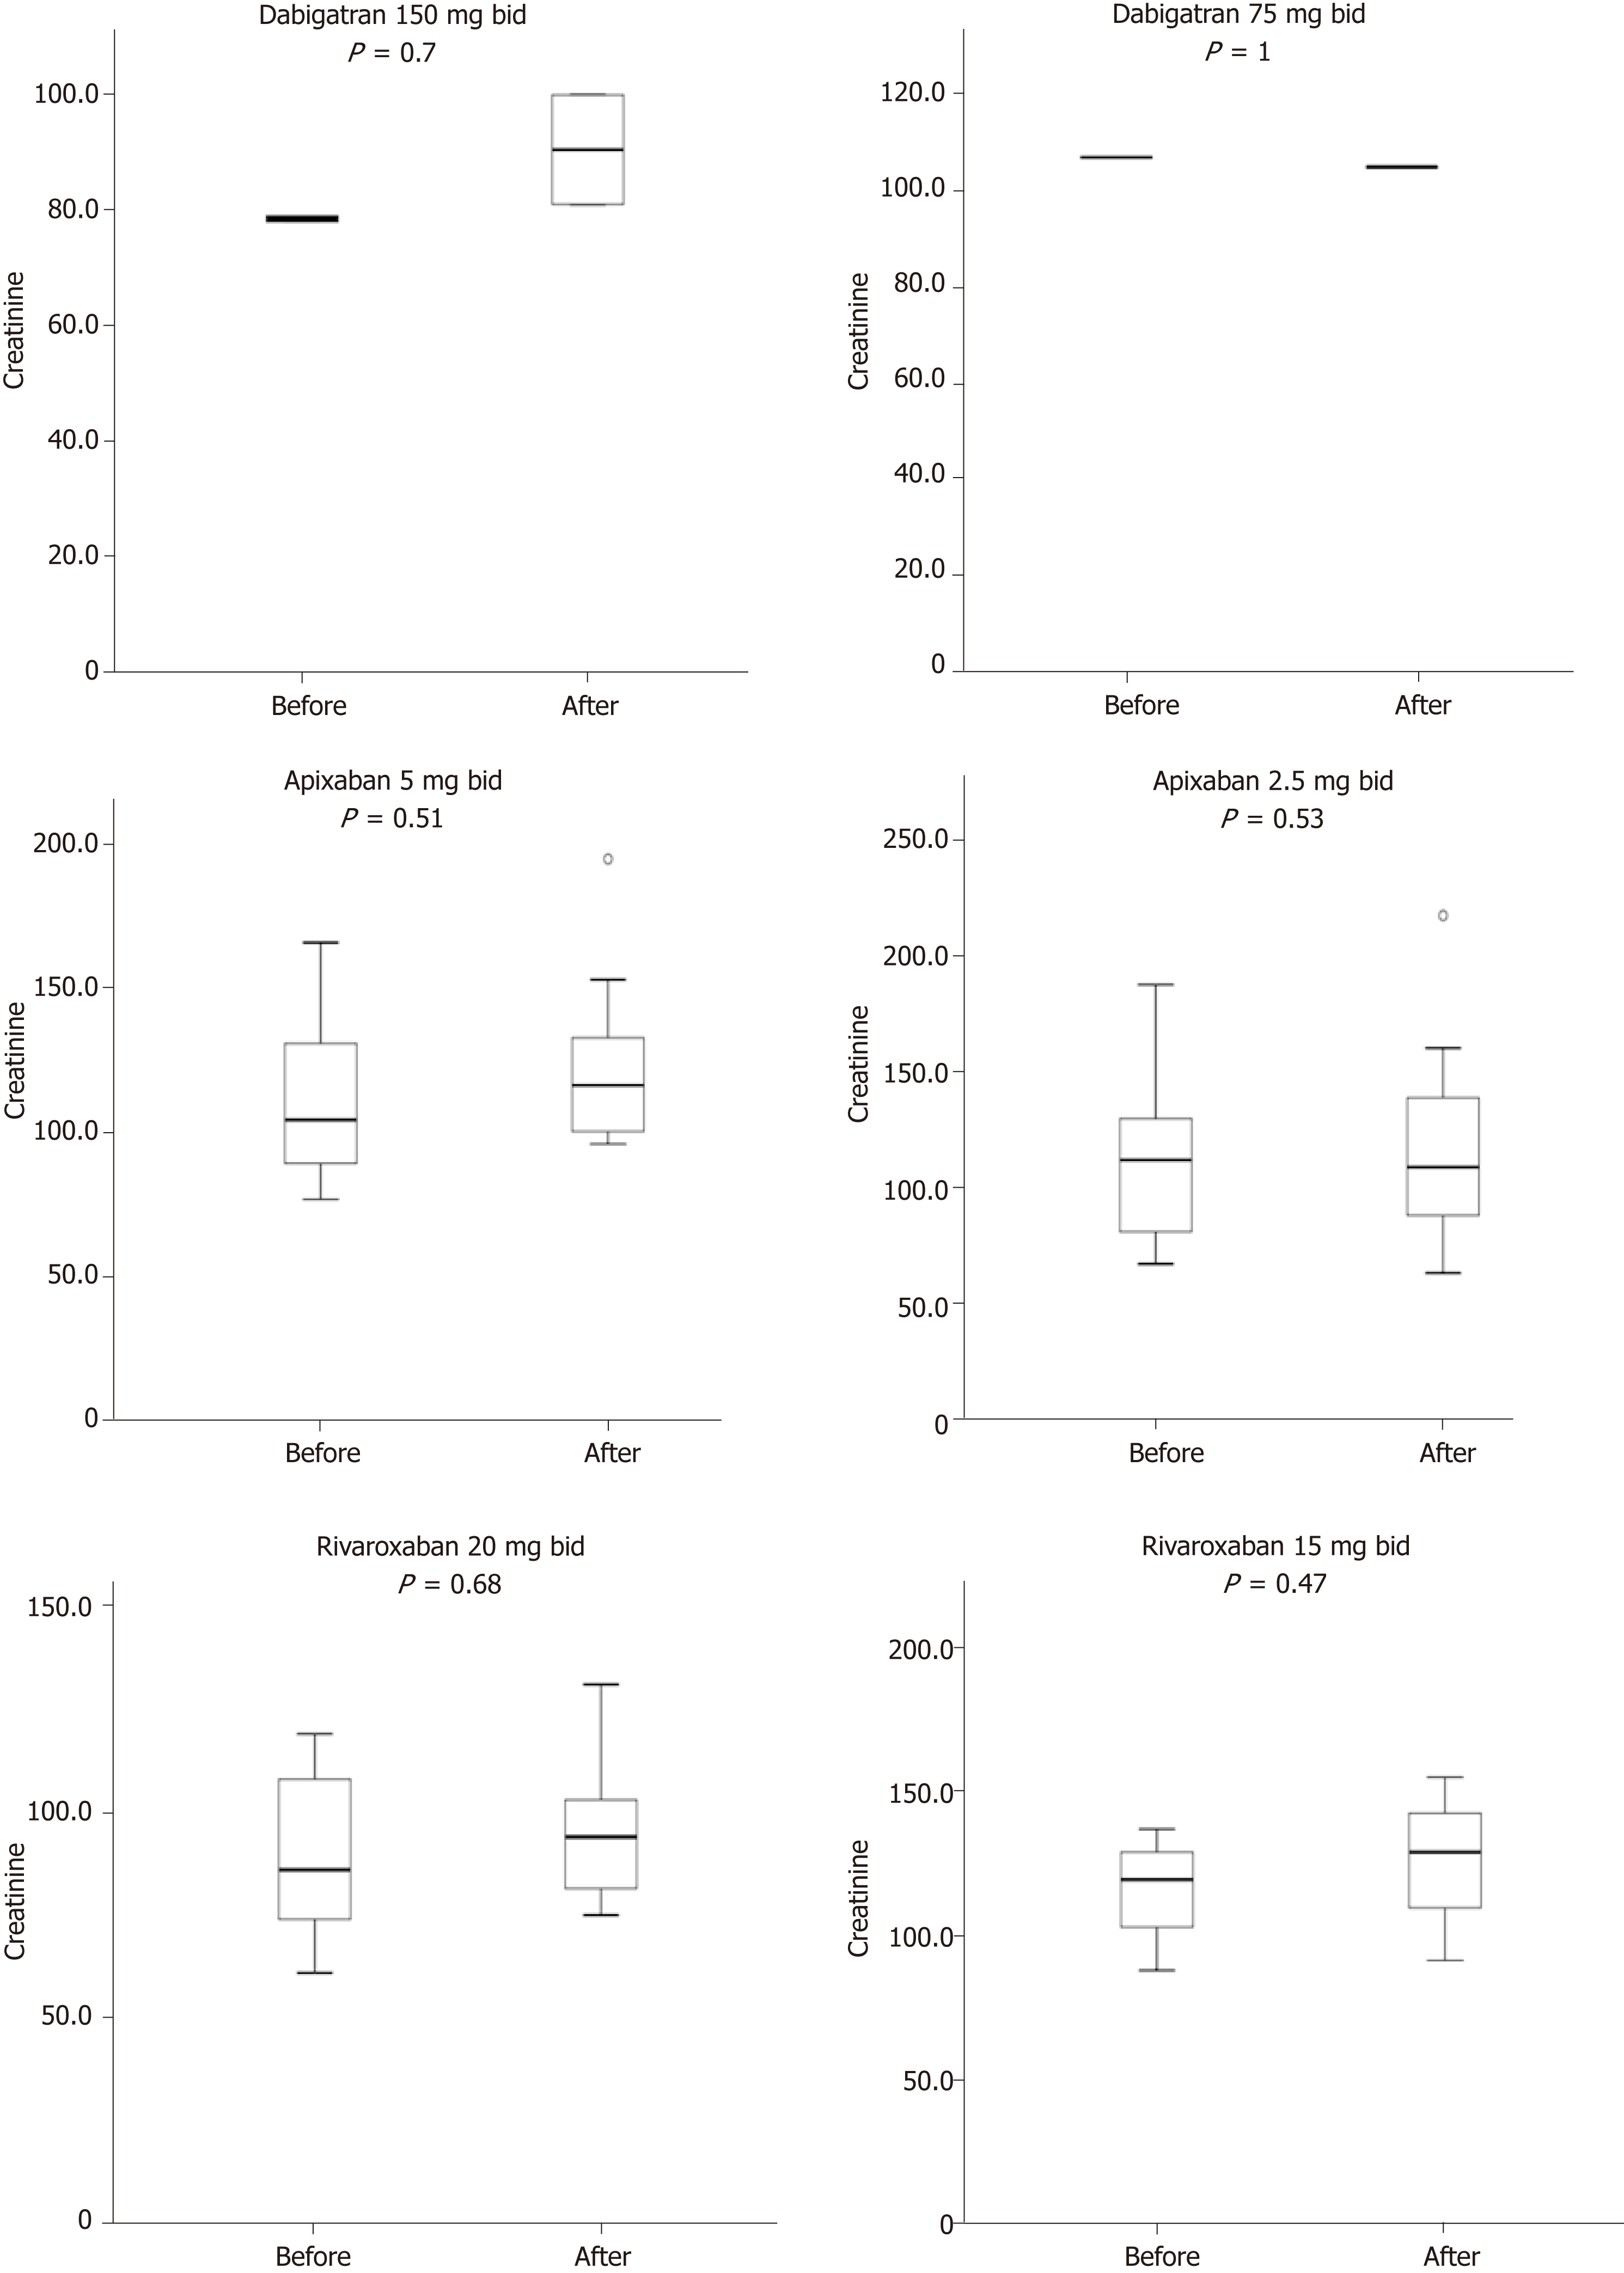
Figure 2 Estimated glomerular filtration rate before and after treatments with novel oral anticoagulants.
Boxplots showing the distribution of estimated glomerular filtration rate levels (mL/min/1.73 m2) before and after novel oral anticoagulants treatment. Points indicate individual patients, with colors representing age groups.
- Citation: Bukhari MA, Al-Theaby A, Tawhari M, Al-Shaggag A, Pyrke R, Gangji A, Treleaven D, Ribic C. Efficacy and safety of non-vitamin K antagonist oral anticoagulants post-kidney transplantation. World J Transplant 2019; 9(6): 134-144
- URL: https://www.wjgnet.com/2220-3230/full/v9/i6/134.htm
- DOI: https://dx.doi.org/10.5500/wjt.v9.i6.134


