Copyright
©The Author(s) 2018.
World J Transplant. Feb 24, 2018; 8(1): 23-37
Published online Feb 24, 2018. doi: 10.5500/wjt.v8.i1.23
Published online Feb 24, 2018. doi: 10.5500/wjt.v8.i1.23
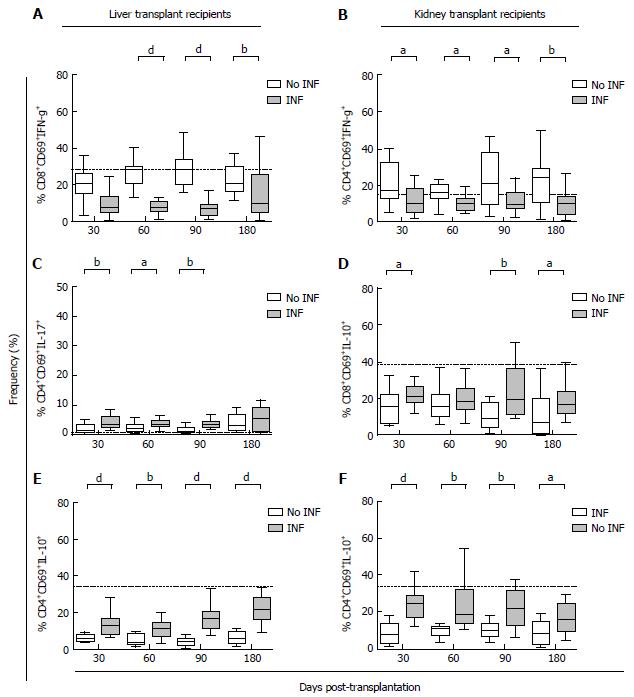
Figure 4 Stratification analysis of the percentage for the intracellular cytokine production capacity of CD4+ and CD8+ T lymphocytes between the 1st and 6th month post-transplantation.
A: % of CD8+CD69+IFNγ+ T lymphocytes in LTr with and without OI; B: % of CD4+CD69+IFNγ+ T lymphocytes in KTr with and without OI; C: % of CD4+CD69+IL-17+ T lymphocytes in LTr with and without OI; D: % of CD8+CD69+IL-10+ T lymphocytes in KTr with and without OI; E: % of CD4+CD69+IL-10+ T lymphocytes in LTr with and without OI; F: % of CD4+CD69+IL-10+ T lymphocytes in KTr with and without OI. LTr: liver transplant recipients; KTr: kidney transplant recipients. aP < 0.05, bP < 0.01, dP < 0.001.
- Citation: Boix F, Llorente S, Eguía J, Gonzalez-Martinez G, Alfaro R, Galián JA, Campillo JA, Moya-Quiles MR, Minguela A, Pons JA, Muro M. In vitro intracellular IFNγ, IL-17 and IL-10 producing T cells correlates with the occurrence of post-transplant opportunistic infection in liver and kidney recipients. World J Transplant 2018; 8(1): 23-37
- URL: https://www.wjgnet.com/2220-3230/full/v8/i1/23.htm
- DOI: https://dx.doi.org/10.5500/wjt.v8.i1.23


