Copyright
©The Author(s) 2017.
World J Transplant. Dec 24, 2017; 7(6): 349-358
Published online Dec 24, 2017. doi: 10.5500/wjt.v7.i6.349
Published online Dec 24, 2017. doi: 10.5500/wjt.v7.i6.349
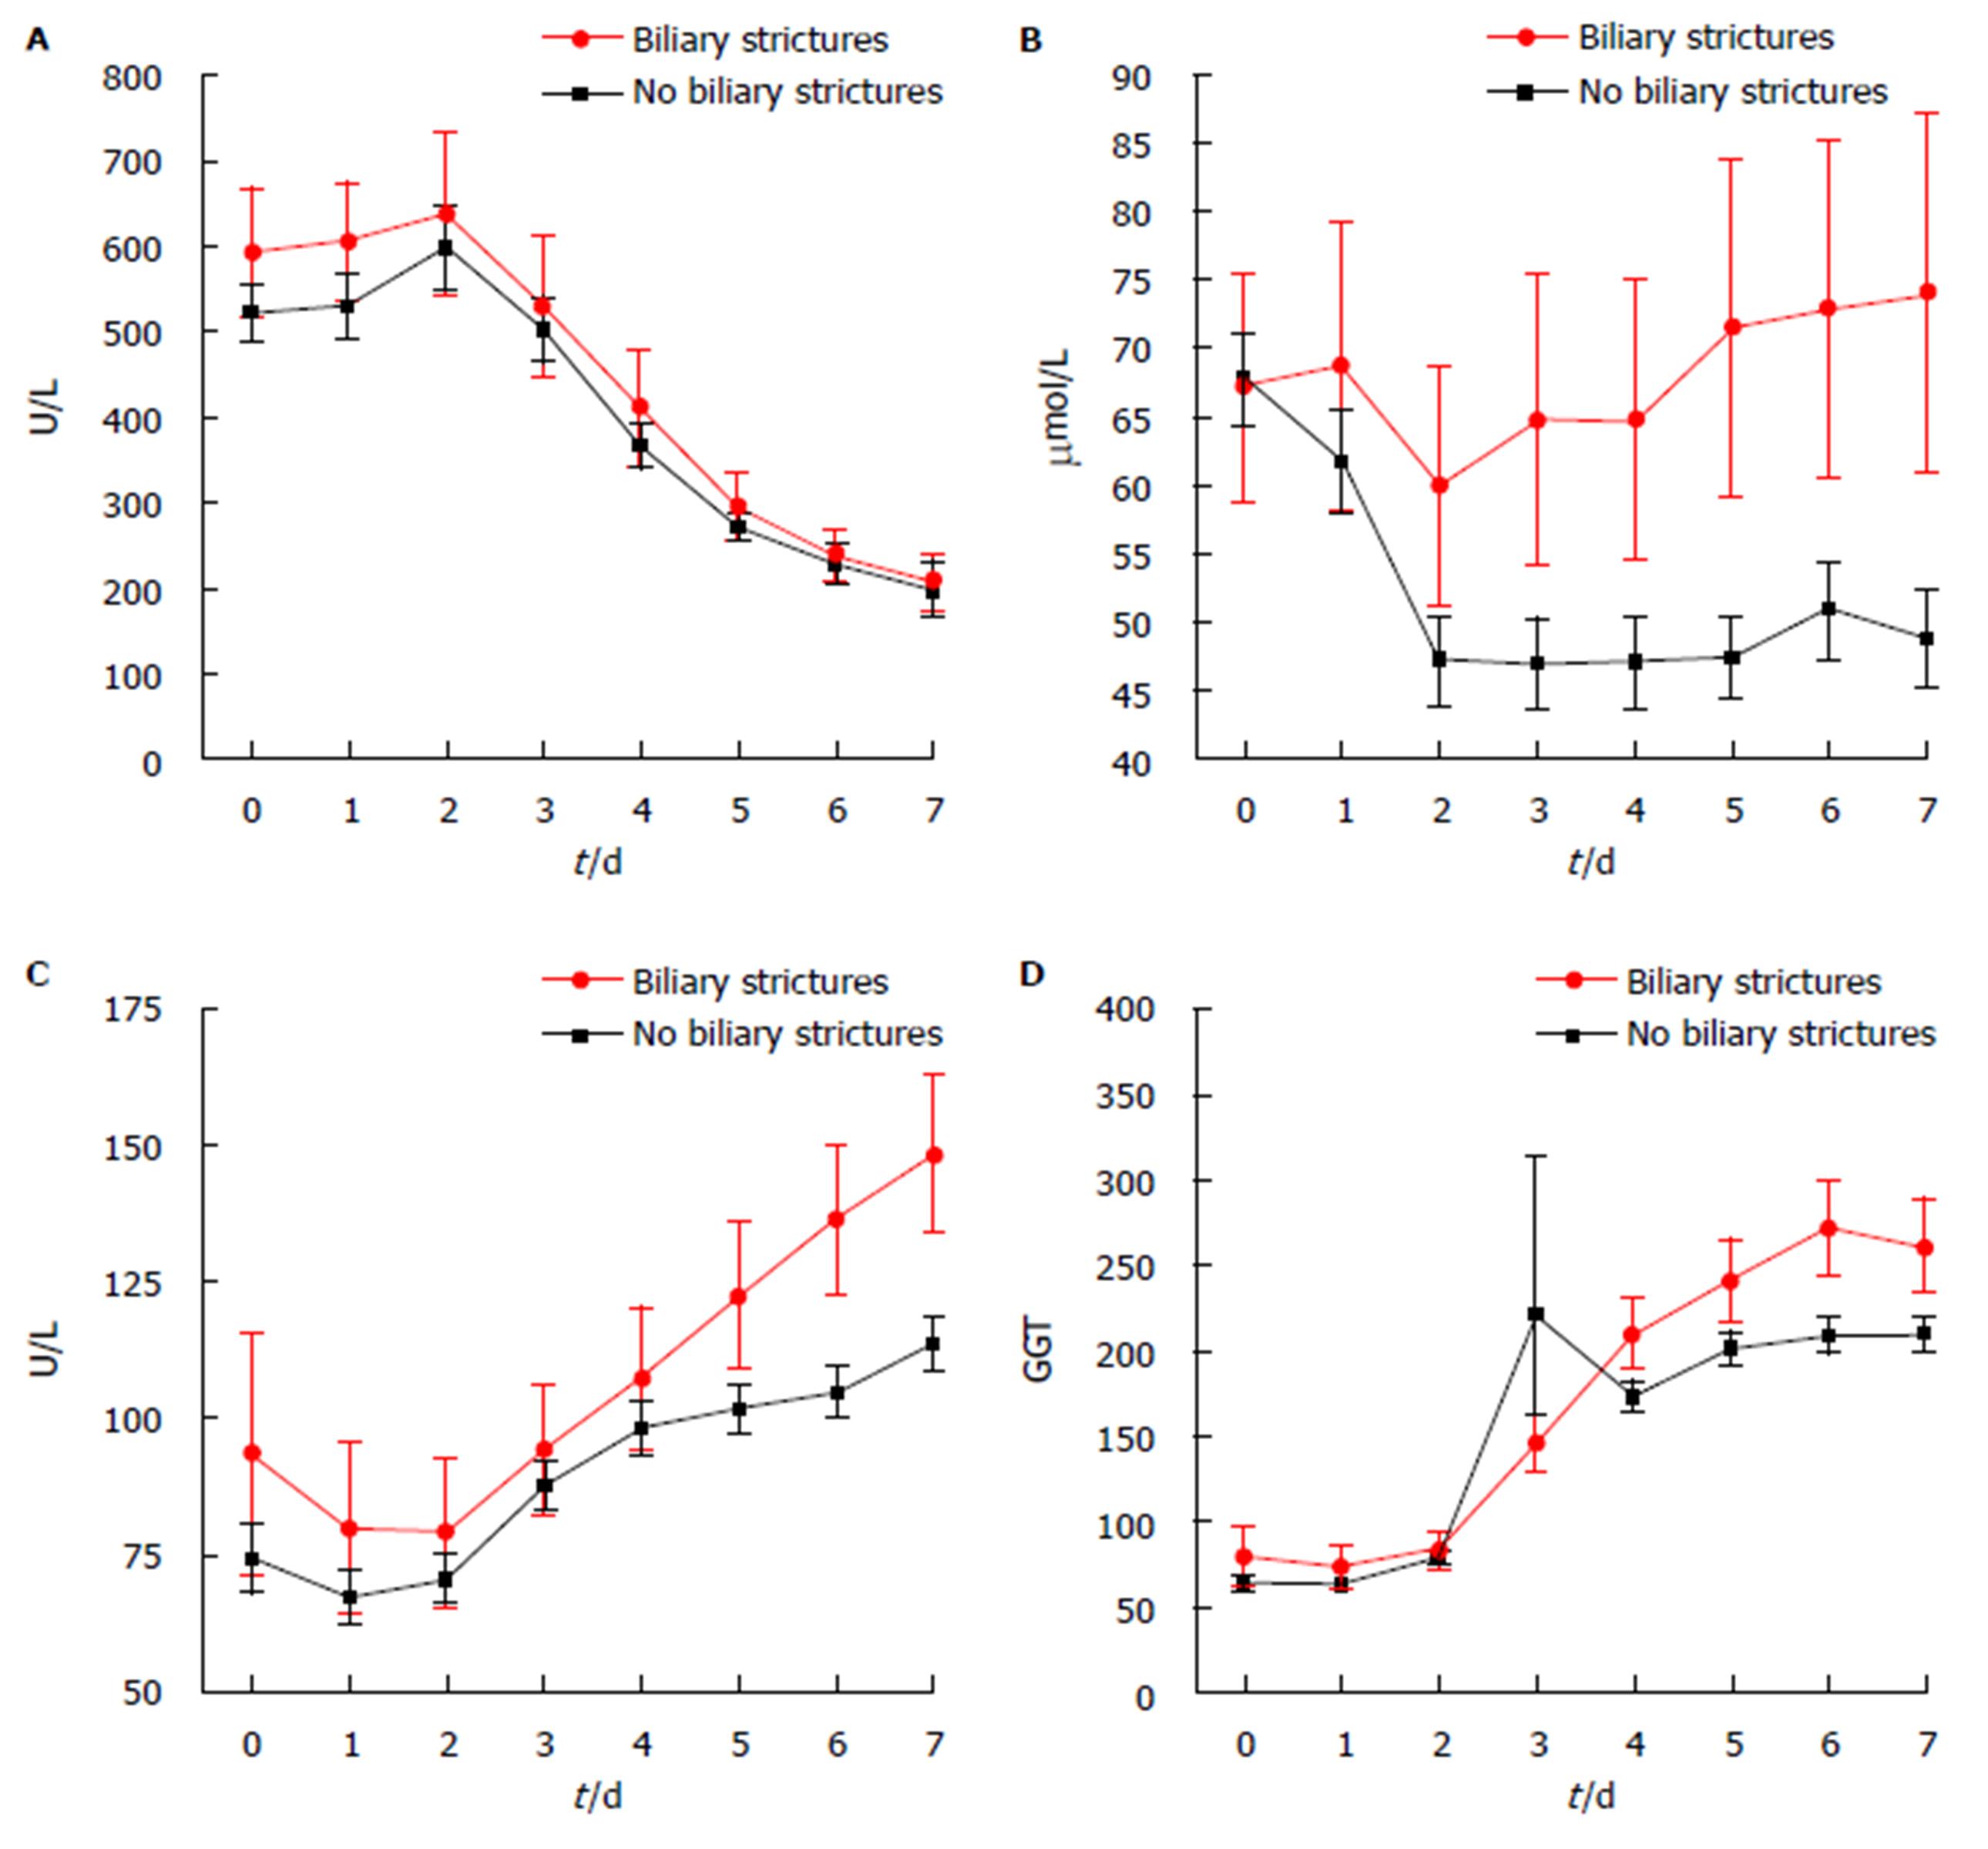
Figure 1 Post-transplant Days 0-7 liver function tests and serum total bilirubin.
This graph demonstrates the trends in A: Serum alanine transaminase; B: Serum total bilirubin; C: Serum alkaline phosphatase; D: Serum γ-Glutamyl transferase (biliary strictures: Day 7 total bilirubin 74 μmol/L and nil biliary stricture: 49 μmol/L, P = 0.012) in recipients with biliary strictures (red line) and recipients without biliary strictures (black line) over post liver transplant Day 0-7.
- Citation: Forrest EA, Reiling J, Lipka G, Fawcett J. Risk factors and clinical indicators for the development of biliary strictures post liver transplant: Significance of bilirubin. World J Transplant 2017; 7(6): 349-358
- URL: https://www.wjgnet.com/2220-3230/full/v7/i6/349.htm
- DOI: https://dx.doi.org/10.5500/wjt.v7.i6.349


