Copyright
©The Author(s) 2017.
World J Transplant. Oct 24, 2017; 7(5): 260-268
Published online Oct 24, 2017. doi: 10.5500/wjt.v7.i5.260
Published online Oct 24, 2017. doi: 10.5500/wjt.v7.i5.260
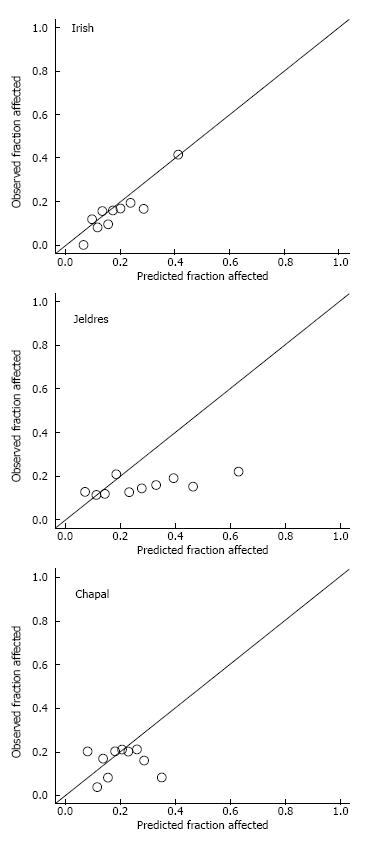
Figure 2 Calibration plot of: The delayed graft function risk calculator (Irish et al[9]), the Jeldres scoring system[10] and the DGFS scoring system (Chapal et al[11]) to predict delayed graft function.
Patients were divided into 10 subgroups (deciles of increased DGF risk), based upon the risk prediction. Each figure plots the mean predicted probability (X-axis) of DGF against the observed prevalence of DGF (Y-axis) (Hosmer-Lemeshow). The P-values were 0.74 for the Irish score, < 0.05 for the Jeldres score and 0.02 for the Chapal score. DGF: Delayed graft function.
- Citation: Michalak M, Wouters K, Fransen E, Hellemans R, Van Craenenbroeck AH, Couttenye MM, Bracke B, Ysebaert DK, Hartman V, De Greef K, Chapelle T, Roeyen G, Van Beeumen G, Emonds MP, Abramowicz D, Bosmans JL. Prediction of delayed graft function using different scoring algorithms: A single-center experience. World J Transplant 2017; 7(5): 260-268
- URL: https://www.wjgnet.com/2220-3230/full/v7/i5/260.htm
- DOI: https://dx.doi.org/10.5500/wjt.v7.i5.260


