Copyright
©The Author(s) 2017.
World J Transplant. Aug 24, 2017; 7(4): 222-234
Published online Aug 24, 2017. doi: 10.5500/wjt.v7.i4.222
Published online Aug 24, 2017. doi: 10.5500/wjt.v7.i4.222
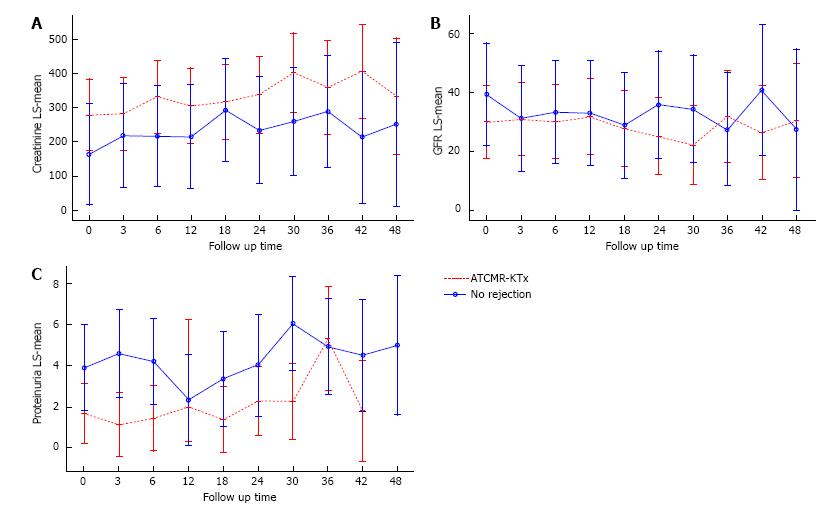
Figure 4 Longitudinal analysis comparing the dynamic changes in serum creatinine (A), glomerular filtration rate (B) and proteinuria (C) throughout the follow up period in the acute T cell-mediated rejection in the kidney transplant (red non-continuous line) and non-rejection (blue continuous line) groups.
The comparisons between overall mean values and mean values at follow-up times were statistically non- significant. Upper and lower limits for 95%CIs at the different time points are indicated. ATCMR-KTx: Acute T cell-mediated rejection in the kidney transplant; GFR: Glomerular filtration rate.
- Citation: Salcido-Ochoa F, Hue SSS, Peng S, Fan Z, Li RL, Iqbal J, Allen Jr JC, Loh AHL. Histopathological analysis of infiltrating T cell subsets in acute T cell-mediated rejection in the kidney transplant. World J Transplant 2017; 7(4): 222-234
- URL: https://www.wjgnet.com/2220-3230/full/v7/i4/222.htm
- DOI: https://dx.doi.org/10.5500/wjt.v7.i4.222


