Copyright
©The Author(s) 2017.
World J Transplant. Aug 24, 2017; 7(4): 222-234
Published online Aug 24, 2017. doi: 10.5500/wjt.v7.i4.222
Published online Aug 24, 2017. doi: 10.5500/wjt.v7.i4.222
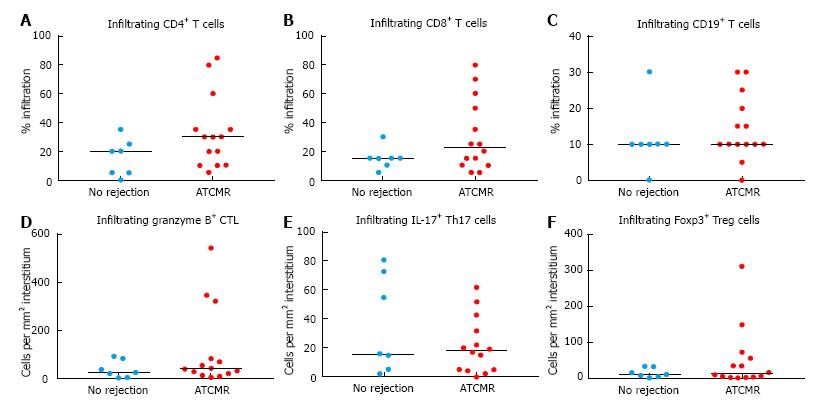
Figure 2 T cell subsets infiltrating kidney tissue, including %CD4+ cells (A), %CD8+ cells (B), %CD19+ cells (C), granzyme B+ cells/mm2 (D), IL-17+ cells/mm2 (E) and Foxp3+ cells/mm2 (F) (all detected by immunohistochemistry) are compared between patients with acute T cell-mediated rejection in the kidney transplant (n = 14) and patients with no rejection (n = 7).
The horizontal lines indicate the median values. Wilcoxon rank-sum test P values for all comparisons were statistically non-significant. ATCMR: Acute T cell-mediated rejection; CTL: Cytotoxic T lymphocyte.
- Citation: Salcido-Ochoa F, Hue SSS, Peng S, Fan Z, Li RL, Iqbal J, Allen Jr JC, Loh AHL. Histopathological analysis of infiltrating T cell subsets in acute T cell-mediated rejection in the kidney transplant. World J Transplant 2017; 7(4): 222-234
- URL: https://www.wjgnet.com/2220-3230/full/v7/i4/222.htm
- DOI: https://dx.doi.org/10.5500/wjt.v7.i4.222


