Copyright
©The Author(s) 2017.
World J Transplant. Jun 24, 2017; 7(3): 203-212
Published online Jun 24, 2017. doi: 10.5500/wjt.v7.i3.203
Published online Jun 24, 2017. doi: 10.5500/wjt.v7.i3.203
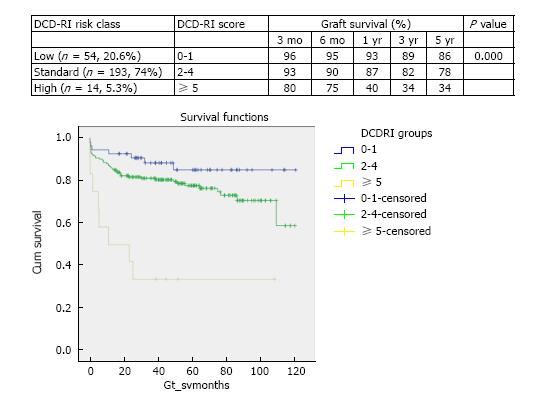
Figure 5 Stratified Kaplan-Meier curves for the cumulative DCD graft survival in relation to their DCD-RI score and respective 3 mo, 6 mo, 1 year, 3 years and 5 years survival (log-rank P = 0.
000). The DCD-RI score divides the study cohort into three DCD-RI risk classes of Low (DCD-RI = 0-1), Standard (DCD-RI = 2-4) and High (DCD-RI ≥ 5).
- Citation: Khorsandi SE, Giorgakis E, Vilca-Melendez H, O’Grady J, Heneghan M, Aluvihare V, Suddle A, Agarwal K, Menon K, Prachalias A, Srinivasan P, Rela M, Jassem W, Heaton N. Developing a donation after cardiac death risk index for adult and pediatric liver transplantation. World J Transplant 2017; 7(3): 203-212
- URL: https://www.wjgnet.com/2220-3230/full/v7/i3/203.htm
- DOI: https://dx.doi.org/10.5500/wjt.v7.i3.203


