Copyright
©The Author(s) 2017.
World J Transplant. Feb 24, 2017; 7(1): 34-42
Published online Feb 24, 2017. doi: 10.5500/wjt.v7.i1.34
Published online Feb 24, 2017. doi: 10.5500/wjt.v7.i1.34
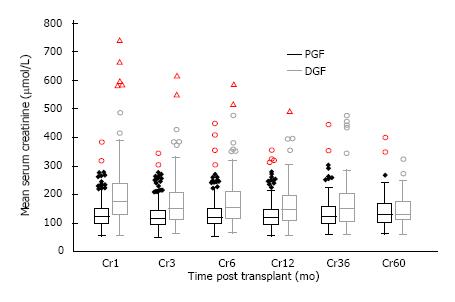
Figure 5 Allograft function according to delayed graft function or primary graft function.
Mean serum creatinine was 203.4 ± 120.0, 172.3 ± 86.6, 161.9 ± 74.9, 167.2 ± 86.1 and 149.6 ± 59.4 μmol/L at 1, 6, 12, 36, 60 mo post-transplant in the DGF group compared with 132.4 ± 48.6, 133.8 ± 56.7, 127.8 ± 43.6, 138.4 ± 47.7 and 143.0 ± 65.2 4 μmol/L in the PGF group; giving a P value of < 0.01 at 1 to 12 mo, a P value of 0.015 at 36 mo and 0.70 at 60 mo. DGF: Delayed graft function; PGF: Primary graft function.
- Citation: Willicombe M, Rizzello A, Goodall D, Papalois V, McLean AG, Taube D. Risk factors and outcomes of delayed graft function in renal transplant recipients receiving a steroid sparing immunosuppression protocol. World J Transplant 2017; 7(1): 34-42
- URL: https://www.wjgnet.com/2220-3230/full/v7/i1/34.htm
- DOI: https://dx.doi.org/10.5500/wjt.v7.i1.34


