Copyright
©The Author(s) 2016.
World J Transplant. Mar 24, 2016; 6(1): 69-90
Published online Mar 24, 2016. doi: 10.5500/wjt.v6.i1.69
Published online Mar 24, 2016. doi: 10.5500/wjt.v6.i1.69
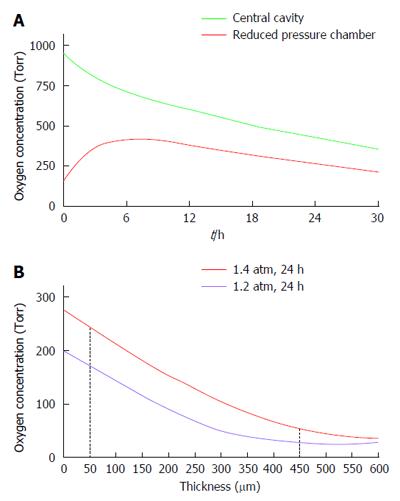
Figure 10 Predictions of the mathematical model for PO2 levels.
The parameters of the model were set as follow: Islet dose in each of the 2 islet modules, 60000 IEQ; surface density of 3600 IEQ/cm2, and OCR of 3.6 pmoles/IEQ/min. A: PO2 profile at the central cavity (green line) and at the “reduced pressure chamber” (red line) of a porcine-type β-Air device. The central cavity was refueled with 95% oxygen/5% CO2 at 1.4 atm (1011 Torr); B: PO2 across a section of an islet module of a β-Air device refueled with 95% oxygen at either 1.2 (purple line) or 1.4 (red line) atm. The red dashed lines represent distances of 50 and 450 μm from the chamber-islet module boundary.
- Citation: Barkai U, Rotem A, de Vos P. Survival of encapsulated islets: More than a membrane story. World J Transplant 2016; 6(1): 69-90
- URL: https://www.wjgnet.com/2220-3230/full/v6/i1/69.htm
- DOI: https://dx.doi.org/10.5500/wjt.v6.i1.69


