Copyright
©The Author(s) 2015.
World J Transplant. Dec 24, 2015; 5(4): 165-182
Published online Dec 24, 2015. doi: 10.5500/wjt.v5.i4.165
Published online Dec 24, 2015. doi: 10.5500/wjt.v5.i4.165
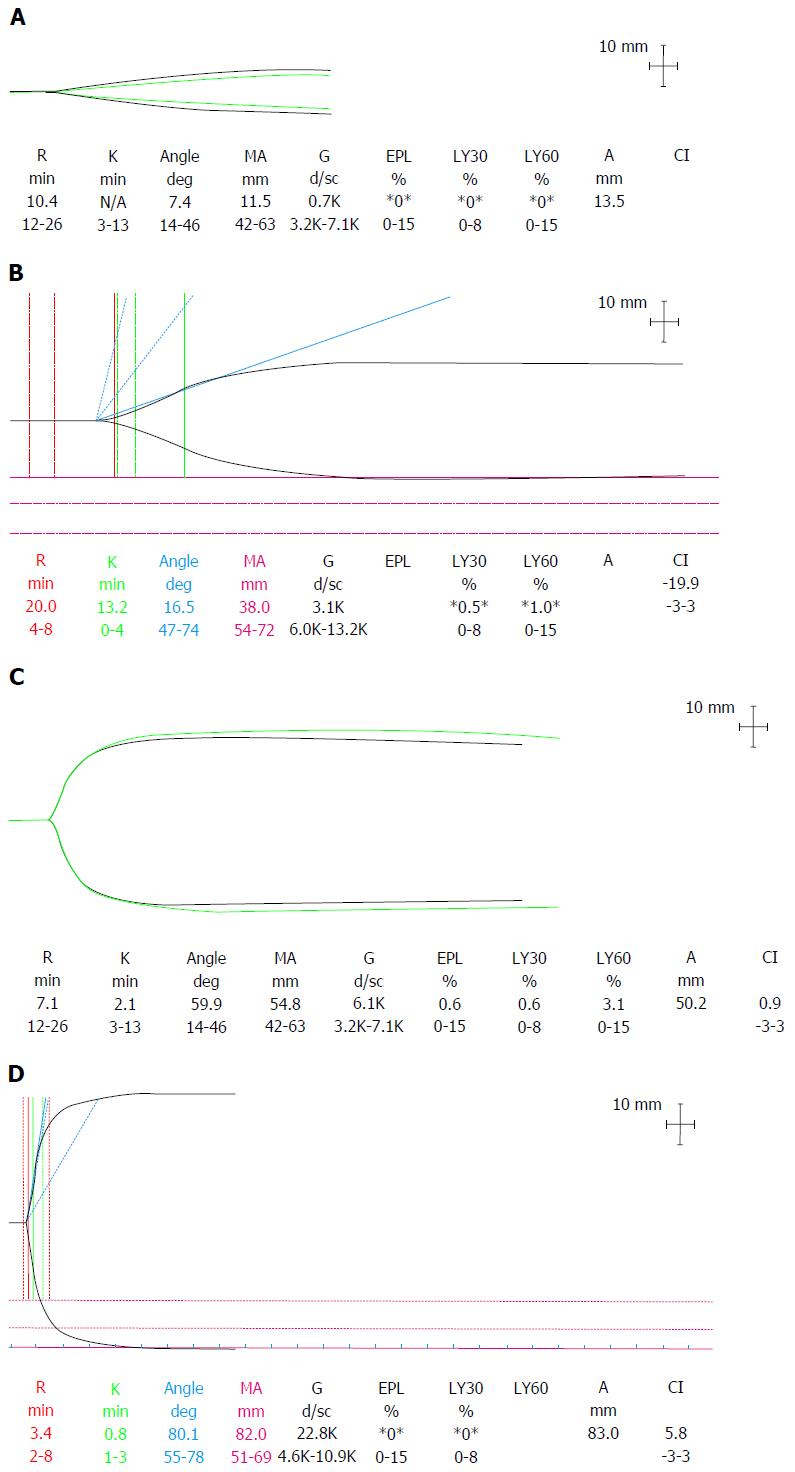
Figure 5 Thromboelastography traces depicting.
A: Dilutional coagulopathy with loss of endogenous thrombin generating potential, low fibrinogen and platelets seen as a typical “arrowhead” trace; B: Hypocoagulable state with prolonged R time but retention of thrombin generation; C: Normal coagulation profile; D: Hypercoagulability with a short R time, steep rate of clot formation (α angle) and increased clot MA. R: Reaction time; K: Kinetics time taken to achieve a certain level of clot strength (20 mm); MA: Maximum amplitude; G: Log derivation of the MA; EPL: Estimated percent lysis; Ly30: Lysis at 30 min; Ly60: Lysis at 60 min; CI: Coagulation index.
- Citation: Donohue CI, Mallett SV. Reducing transfusion requirements in liver transplantation. World J Transplant 2015; 5(4): 165-182
- URL: https://www.wjgnet.com/2220-3230/full/v5/i4/165.htm
- DOI: https://dx.doi.org/10.5500/wjt.v5.i4.165


