Copyright
©2014 Baishideng Publishing Group Inc.
World J Transplant. Sep 24, 2014; 4(3): 153-167
Published online Sep 24, 2014. doi: 10.5500/wjt.v4.i3.153
Published online Sep 24, 2014. doi: 10.5500/wjt.v4.i3.153
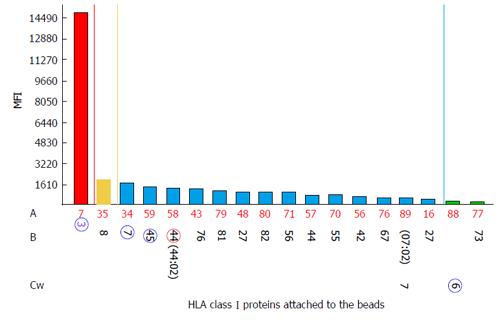
Figure 9 Anti-Class I antibodies detected in the serum of kidney transplant candidate C.
The numbers in blue circles indicate HLA specificities mismatched with the 1st donor. The number in red circle indicates HLA specificity mismatched with the current donor; the numbers in parenthesis indicate allelic assignment of HLA. Y axis indicates MFI values, X axis indicates bead number and HLA-A and -B loci specificities. Colored bars represent MFI values of different intensity: Green < 500; blue 501-1600; brown 1601-2500; red > 2500. HLA: Human leukocyte antigen; MFI: Mean fluorescence intensity.
- Citation: Lobashevsky AL. Methodological aspects of anti-human leukocyte antigen antibody analysis in solid organ transplantation. World J Transplant 2014; 4(3): 153-167
- URL: https://www.wjgnet.com/2220-3230/full/v4/i3/153.htm
- DOI: https://dx.doi.org/10.5500/wjt.v4.i3.153


