Copyright
©2014 Baishideng Publishing Group Inc.
World J Transplant. Sep 24, 2014; 4(3): 153-167
Published online Sep 24, 2014. doi: 10.5500/wjt.v4.i3.153
Published online Sep 24, 2014. doi: 10.5500/wjt.v4.i3.153
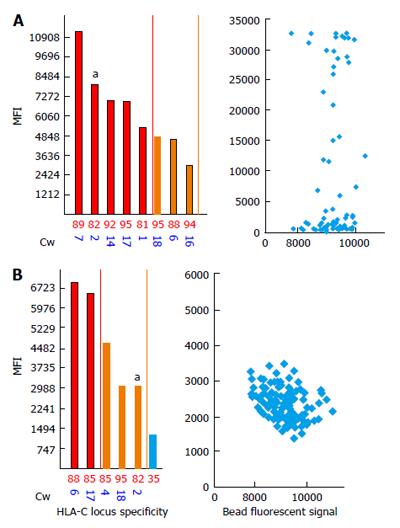
Figure 4 Uneven bead (bead #82) distribution results in falsely positive reactivity of antibodies to human leukocyte antigen-C2.
aAnti-HLA-C2 antibodies MFI values in original (A) and repeated (B) samples, respectively. Left panels in figure A and B represent HLA-C locus specific antibody analysis, whereas right panels represent beads distribution on the basis of their fluorescence and MFI values produced by bound antibodies. Colored bars represent MFI values of different intensity: Blue 500-2000, yellow 2001-3000, brown 3001-5000, and red > 5000. Blue diamonds represent beads coated with HLA-C2 proteins. HLA: Human leukocyte antigen; MFI: Mean fluorescence intensity.
- Citation: Lobashevsky AL. Methodological aspects of anti-human leukocyte antigen antibody analysis in solid organ transplantation. World J Transplant 2014; 4(3): 153-167
- URL: https://www.wjgnet.com/2220-3230/full/v4/i3/153.htm
- DOI: https://dx.doi.org/10.5500/wjt.v4.i3.153


