Copyright
©2014 Baishideng Publishing Group Inc.
World J Transplant. Sep 24, 2014; 4(3): 153-167
Published online Sep 24, 2014. doi: 10.5500/wjt.v4.i3.153
Published online Sep 24, 2014. doi: 10.5500/wjt.v4.i3.153
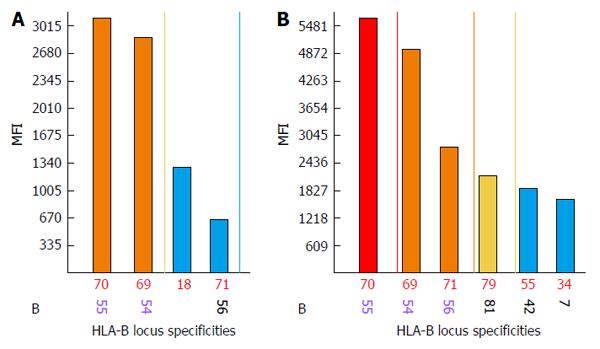
Figure 3 High affinity antibodies against denatured human leukocyte antigen-B55 and human leukocyte antigen-B54 proteins.
A: Acid untreated sample; B: Acid treated sample; Y axis indicates MFI values of the antibodies; X axis indicates HLA-B locus specific antibodies. Colored bars represent MFI values of different intensity: Blue 500-2000, yellow 2001-3000, brown 3001-5000, and red > 5000. HLA: Human leukocyte antigen; MFI: Mean fluorescence intensity.
- Citation: Lobashevsky AL. Methodological aspects of anti-human leukocyte antigen antibody analysis in solid organ transplantation. World J Transplant 2014; 4(3): 153-167
- URL: https://www.wjgnet.com/2220-3230/full/v4/i3/153.htm
- DOI: https://dx.doi.org/10.5500/wjt.v4.i3.153


