Copyright
©2013 Baishideng.
World J Transplant. Sep 24, 2013; 3(3): 36-47
Published online Sep 24, 2013. doi: 10.5500/wjt.v3.i3.36
Published online Sep 24, 2013. doi: 10.5500/wjt.v3.i3.36
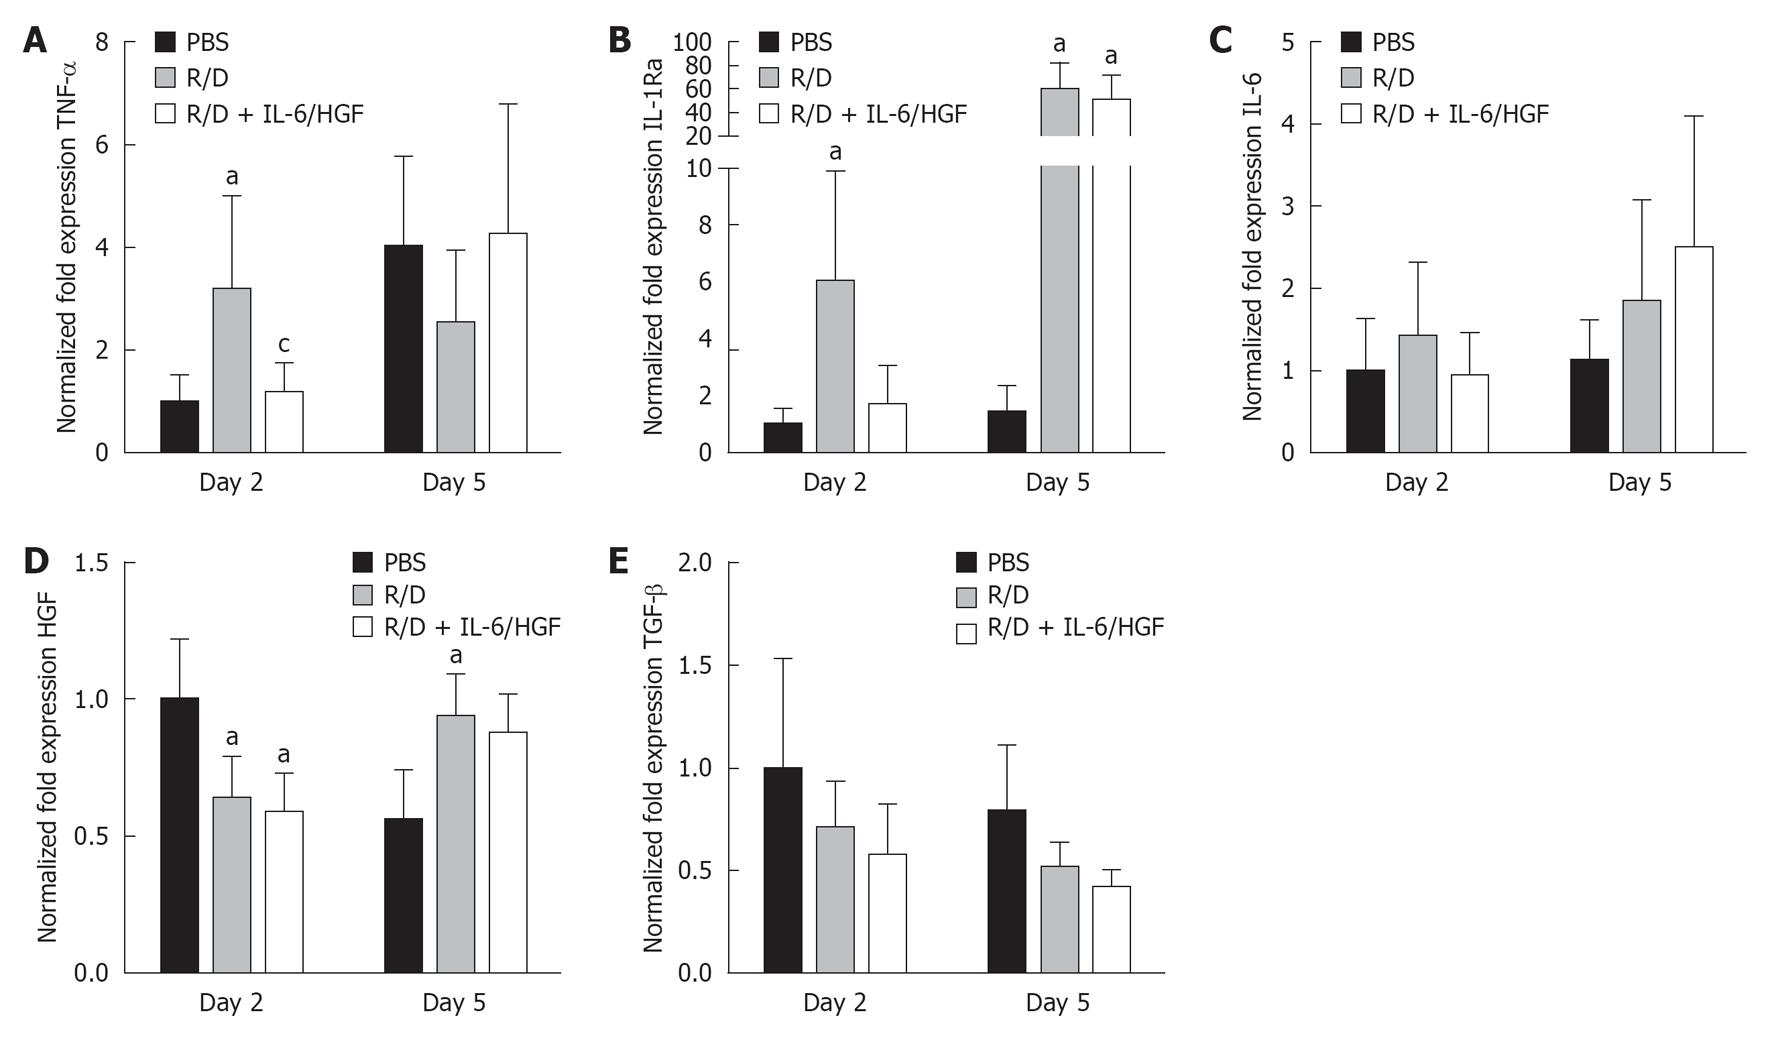
Figure 5 Effects of mammalian target of rapamycin inhibition on inflammation and cell cycle related gene expression.
Hepatic gene expression levels were determined by quantitative reverse transcription-polymerase chain reaction and normalized against TATA binding protein. A: Expression levels of tumor necrosis factor α (TNF-α) at day 2 and 5 after partial hepatectomy (PH); B: Expression levels of interleukin 1 receptor antagonist (IL-1Ra) at day 2 and 5 after PH; C: Expression levels of interleukin 6 (IL-6) at day 2 and 5 after PH; D: Expression levels of hepatocyte growth factor (HGF) at day 2 and 5 after PH; E: Expression levels of transforming growth factor β (TGF-β) at day 2 and 5 after PH. Data are shown as mean ± SE. aP≤ 0.05 vs phosphate buffered saline (PBS); cP≤ 0.05 vs Rapa-Dex (R/D).
- Citation: Fouraschen SM, de Ruiter PE, Kwekkeboom J, de Bruin RW, Kazemier G, Metselaar HJ, Tilanus HW, van der Laan LJ, de Jonge J. mTOR signaling in liver regeneration: Rapamycin combined with growth factor treatment. World J Transplant 2013; 3(3): 36-47
- URL: https://www.wjgnet.com/2220-3230/full/v3/i3/36.htm
- DOI: https://dx.doi.org/10.5500/wjt.v3.i3.36


