Copyright
©The Author(s) 2025.
World J Transplant. Jun 18, 2025; 15(2): 99992
Published online Jun 18, 2025. doi: 10.5500/wjt.v15.i2.99992
Published online Jun 18, 2025. doi: 10.5500/wjt.v15.i2.99992
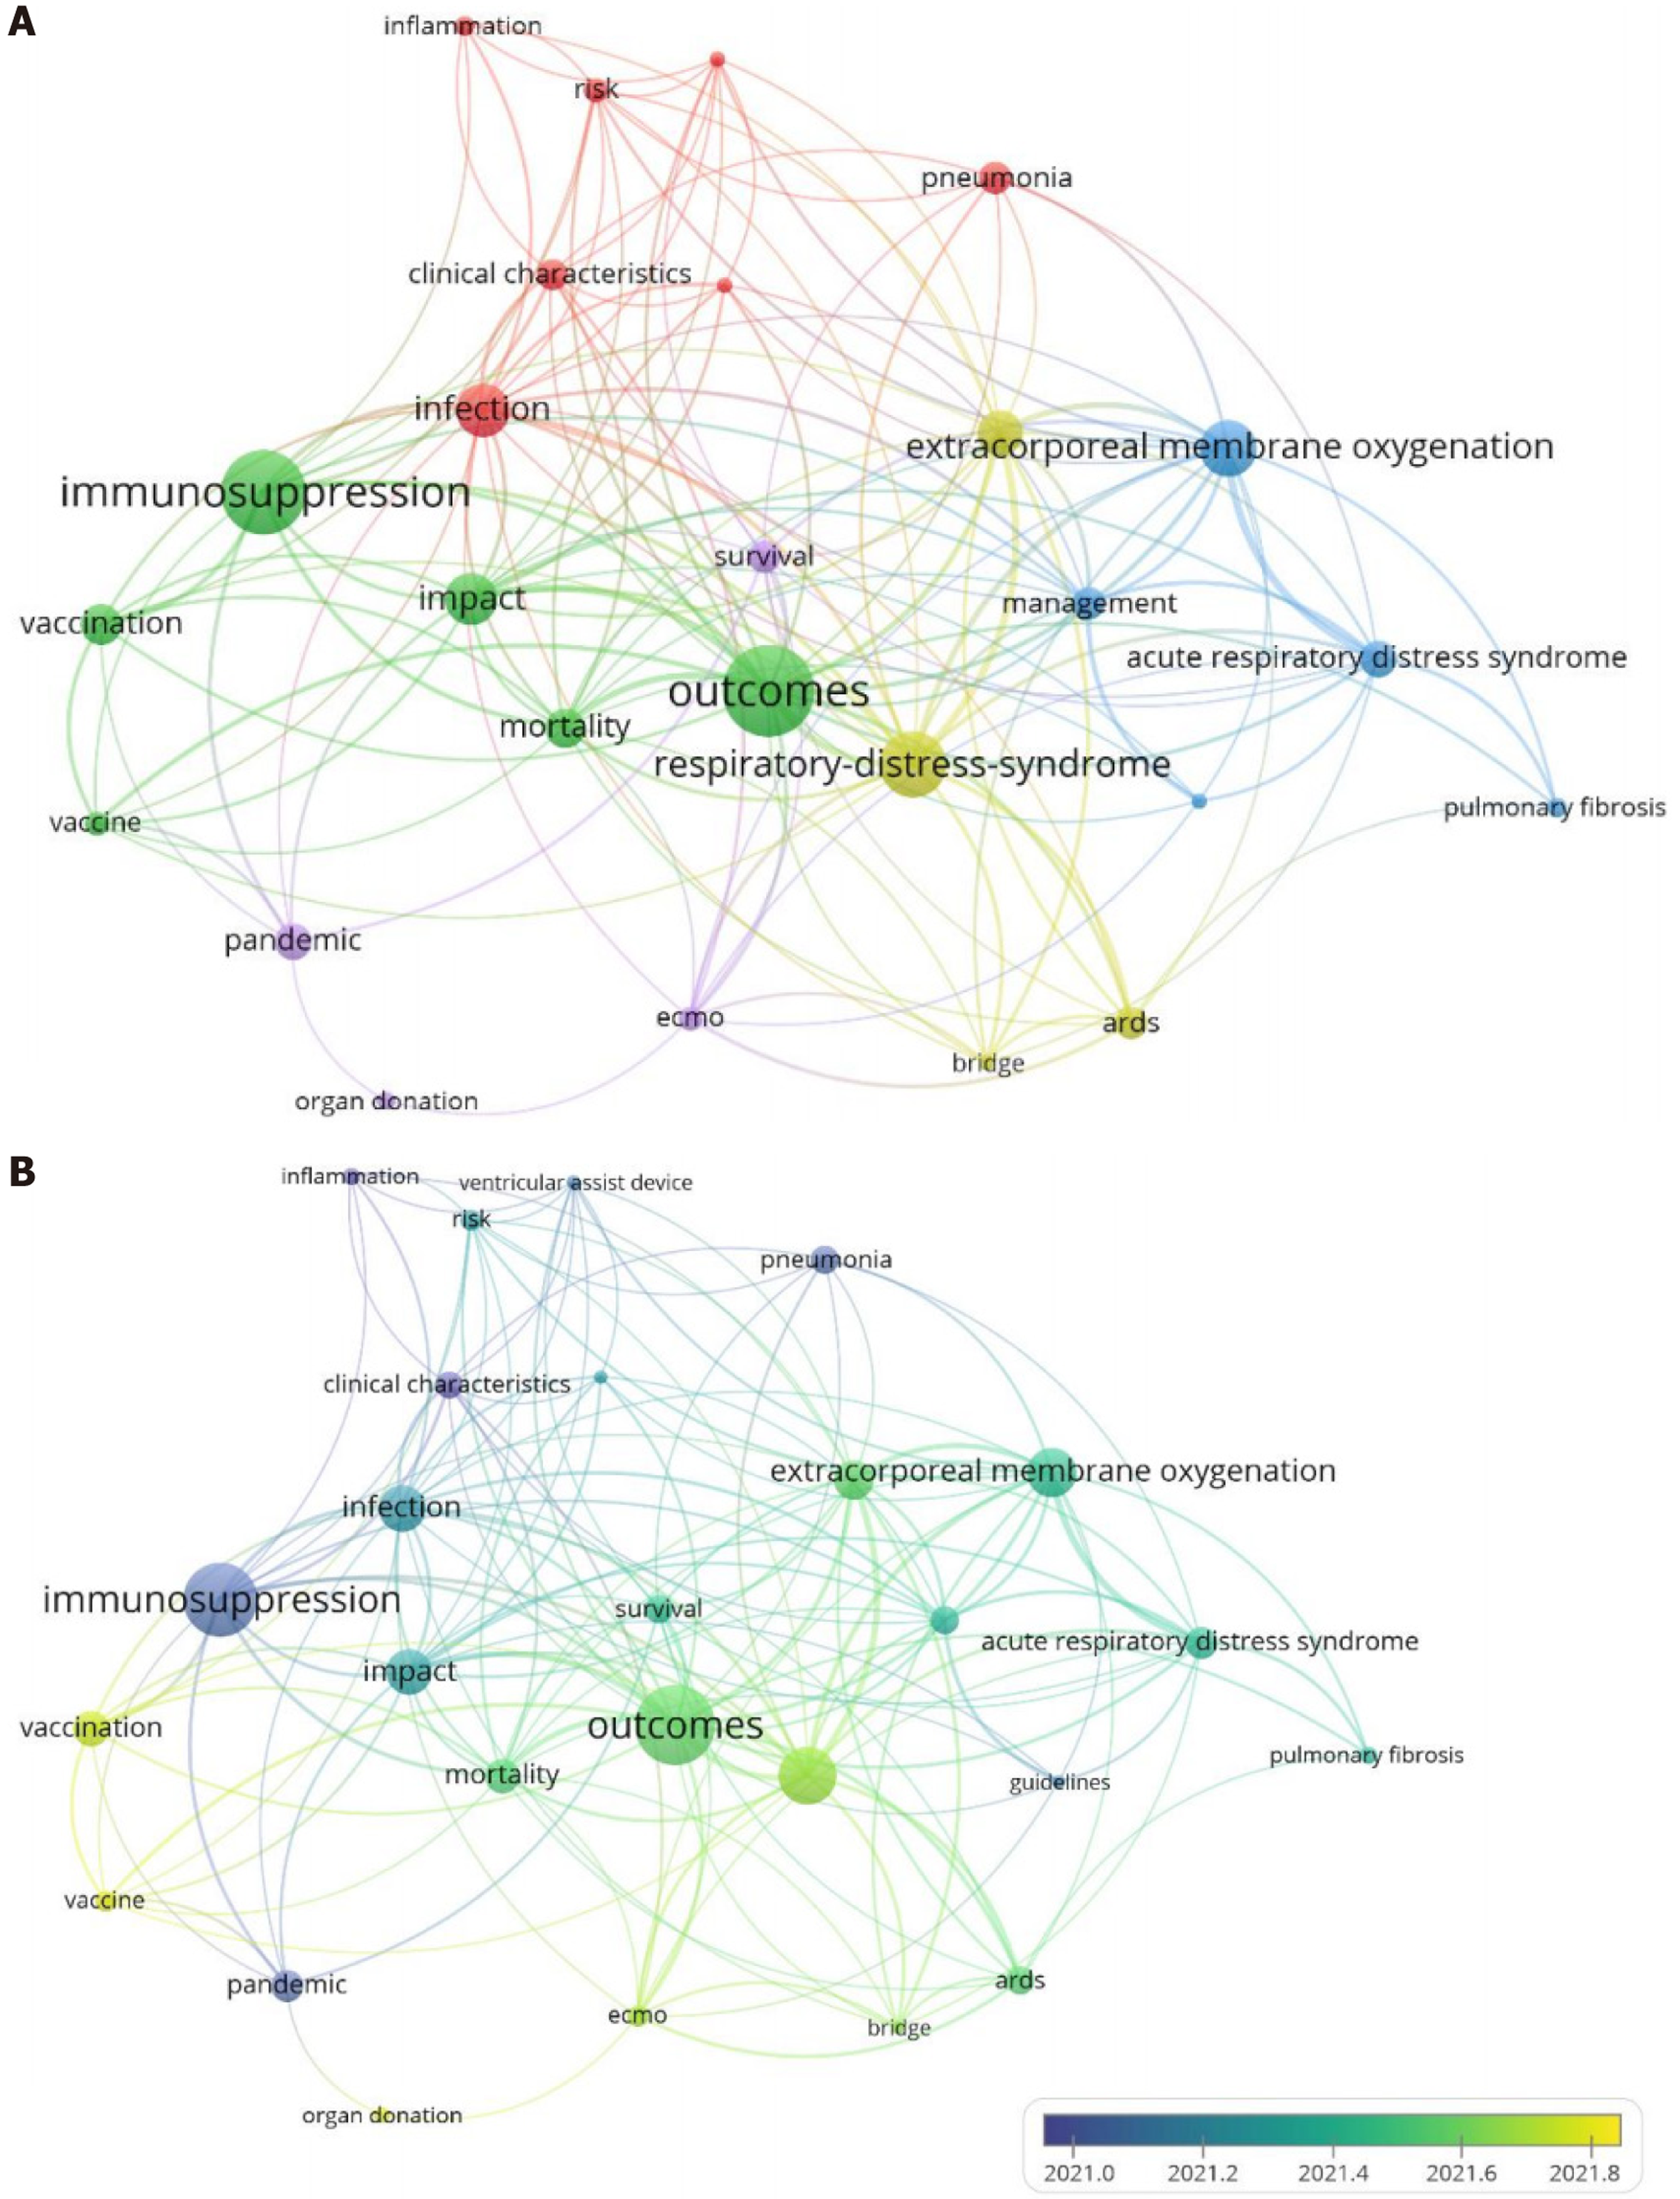
Figure 3 Network visualizations of keyword frequency.
A: It presents a network visualization depicting the most frequently occurring keywords within the dataset, illustrating the interconnections and prominence of each term; B: It offers an overlay network visualization that highlights the most occurring keywords, with an emphasis on their distribution and changes over time, providing insights into temporal trends and shifts in keyword significance.
- Citation: Yaghmour N, Alramini D, Alsarayrah M, Abuassi M, Al-Rameni A, Aladaileh M, Al-Abdallat H, Rawashdeh B. COVID-19's impact on heart and lung transplantation: Citation-based analysis of research output. World J Transplant 2025; 15(2): 99992
- URL: https://www.wjgnet.com/2220-3230/full/v15/i2/99992.htm
- DOI: https://dx.doi.org/10.5500/wjt.v15.i2.99992


