Copyright
©The Author(s) 2025.
World J Transplant. Mar 18, 2025; 15(1): 99642
Published online Mar 18, 2025. doi: 10.5500/wjt.v15.i1.99642
Published online Mar 18, 2025. doi: 10.5500/wjt.v15.i1.99642
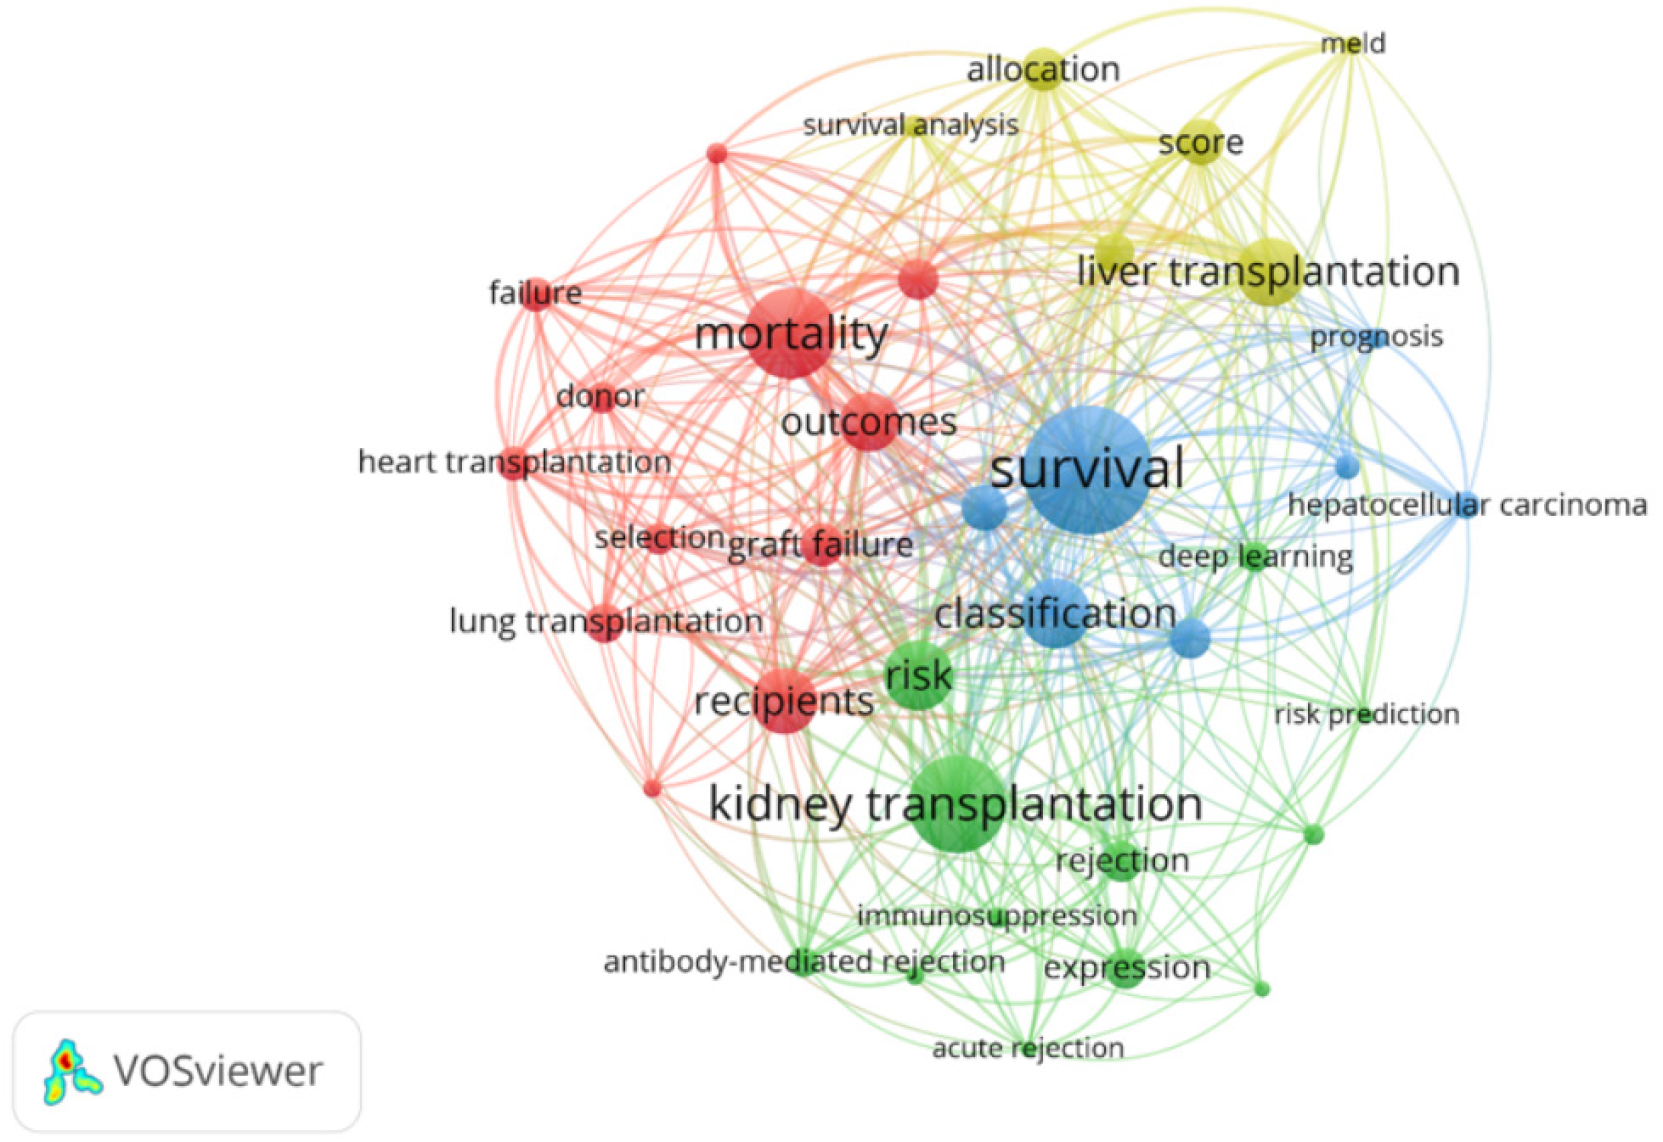
Figure 4 Cluster visualization of the most frequently occurring keywords and their interconnections.
Each circle represents a keyword with a label, and the size of the circles indicates the frequency of occurrence. Larger circles indicate that the keyword appears more frequently. Keywords included in the same cluster, which occur frequently together, are displayed in the same color. The distance and line thickness between the two circles show the degree of the relationship.
- Citation: Rawashdeh B, Al-abdallat H, Arpali E, Thomas B, Dunn TB, Cooper M. Machine learning in solid organ transplantation: Charting the evolving landscape. World J Transplant 2025; 15(1): 99642
- URL: https://www.wjgnet.com/2220-3230/full/v15/i1/99642.htm
- DOI: https://dx.doi.org/10.5500/wjt.v15.i1.99642


