Copyright
©The Author(s) 2025.
World J Transplant. Mar 18, 2025; 15(1): 100413
Published online Mar 18, 2025. doi: 10.5500/wjt.v15.i1.100413
Published online Mar 18, 2025. doi: 10.5500/wjt.v15.i1.100413
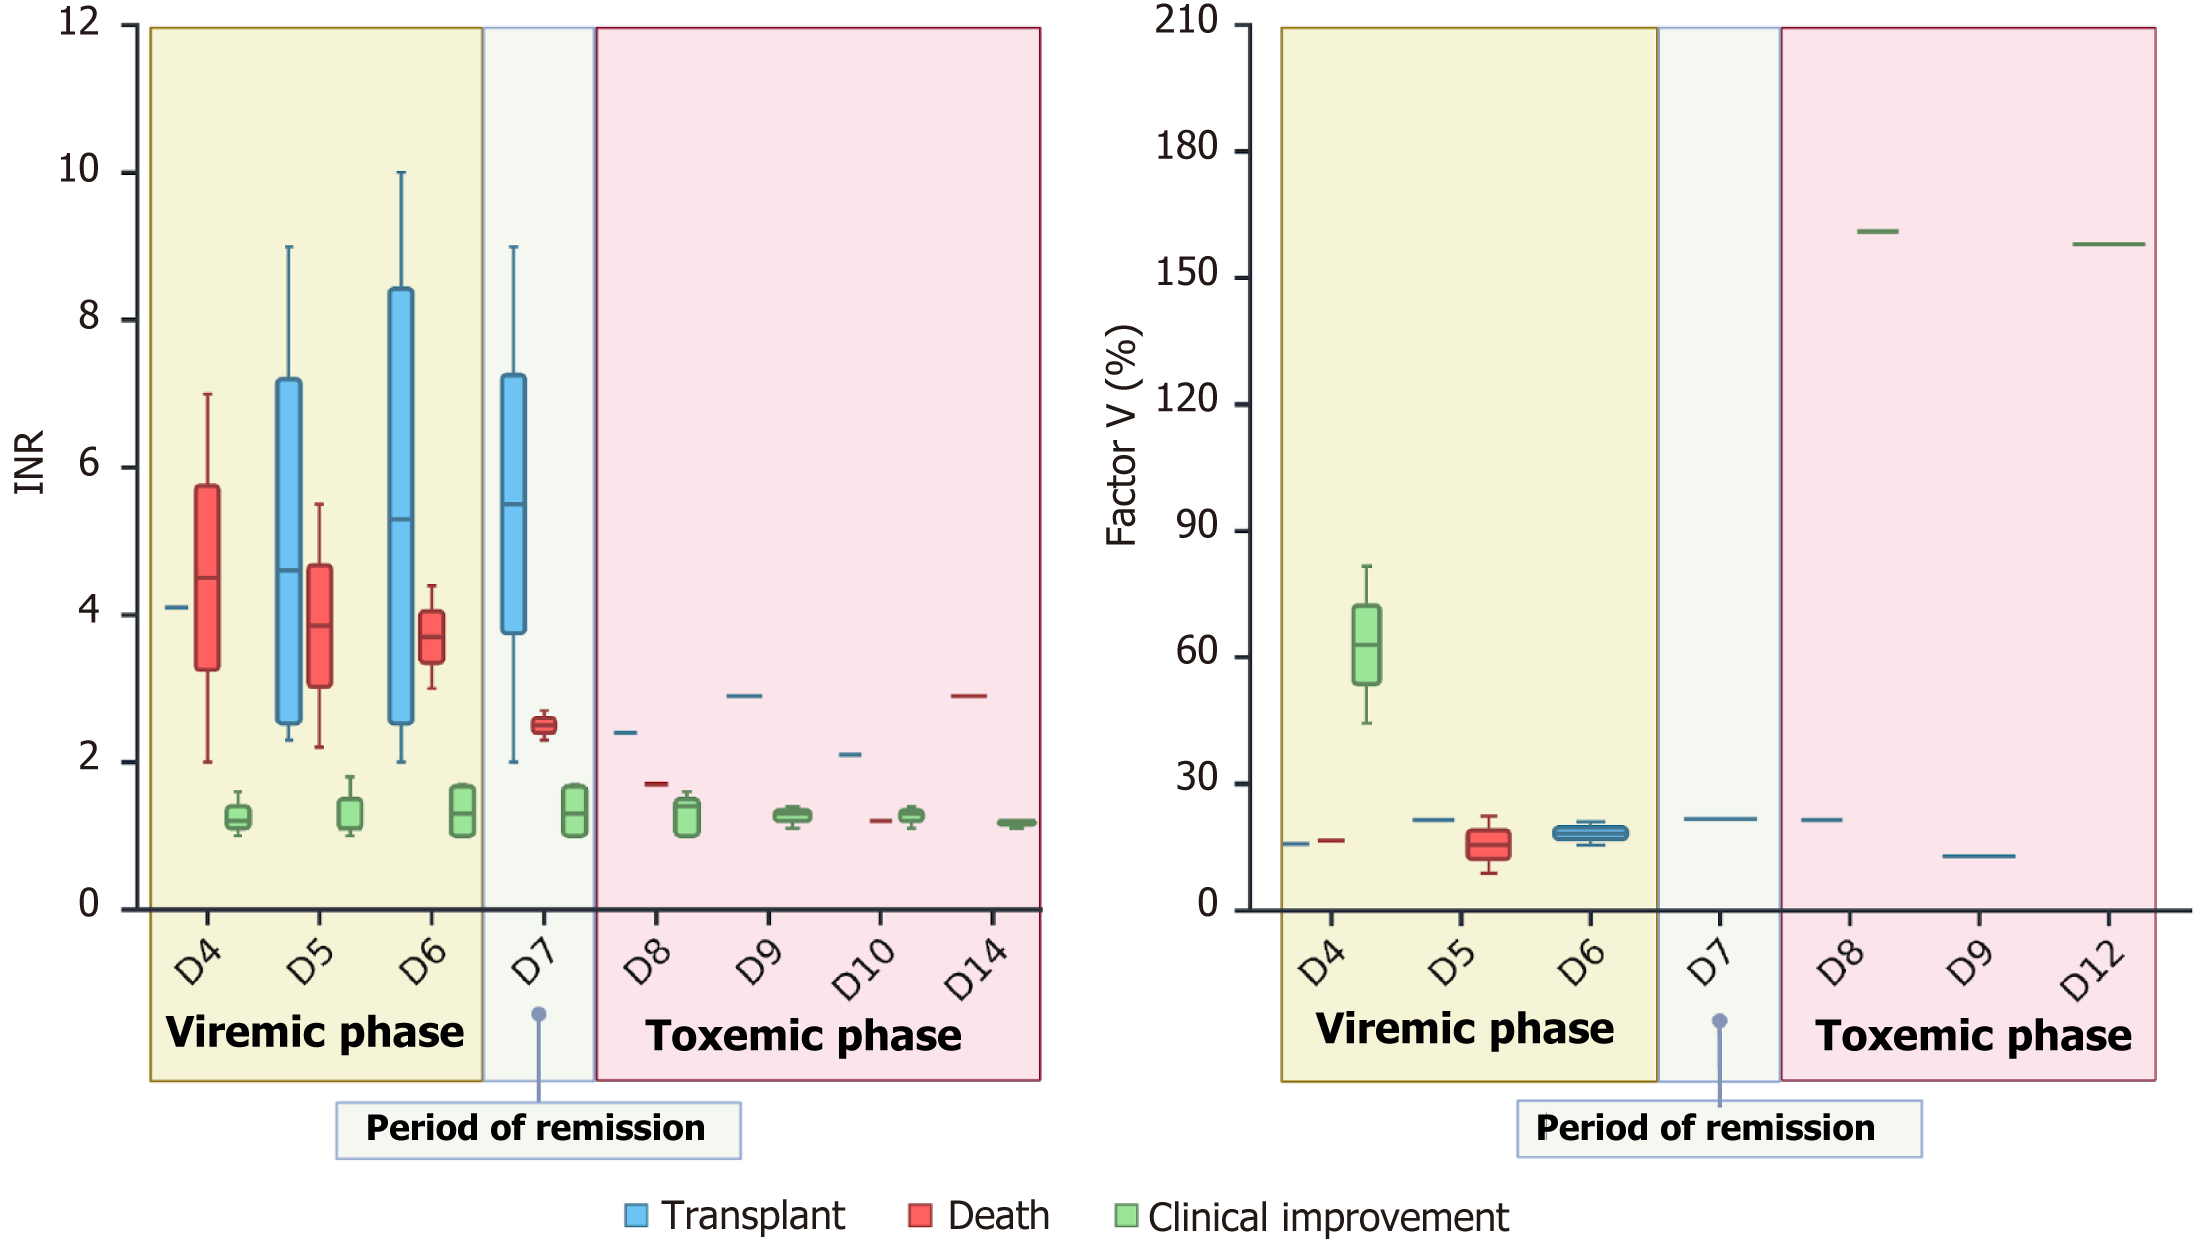
Figure 2 Analysis of international normalized ratio and factor V levels and clinical outcomes over time.
This figure presents a comparative analysis of the international normalized ratio (INR) and factor V levels of patients, categorized by clinical outcomes and day of illness, categorized by the phases of yellow fever (viremia, remission, and toxicity). The figure includes two graphs: (1) One displaying INRs; and (2) The other showing factor V levels. Each data point represents the mean value for the specified day and outcome, with error bars indicating the standard deviation. The panels illustrate how INR and factor V levels vary across different clinical outcomes (transplantation, death, and clinical improvement) and days of illness. Trends reveal associations between elevated or decreased INRs and factor V levels with different clinical results, providing insights into their role in patient outcomes over time. INR: International normalized ratio. D4: Day 4; D5: Day 5; D6: Day 6; D7: Day 7; D8: Day 8; D9: Day 9; D10: Day 10; D12: Day 12; D14: Day 14.
- Citation: Athanasio BDS, Andrade AMF, Costa VV, Castro JF, Garcia SLM, Teixeira MM, Souza DDG, Vidigal PVT, Lima CX. King's College criteria and the Clichy-Villejuif criteria require adjustments for assessing acute liver failure due to yellow fever. World J Transplant 2025; 15(1): 100413
- URL: https://www.wjgnet.com/2220-3230/full/v15/i1/100413.htm
- DOI: https://dx.doi.org/10.5500/wjt.v15.i1.100413


