Copyright
©The Author(s) 2024.
World J Transplant. Sep 18, 2024; 14(3): 93561
Published online Sep 18, 2024. doi: 10.5500/wjt.v14.i3.93561
Published online Sep 18, 2024. doi: 10.5500/wjt.v14.i3.93561
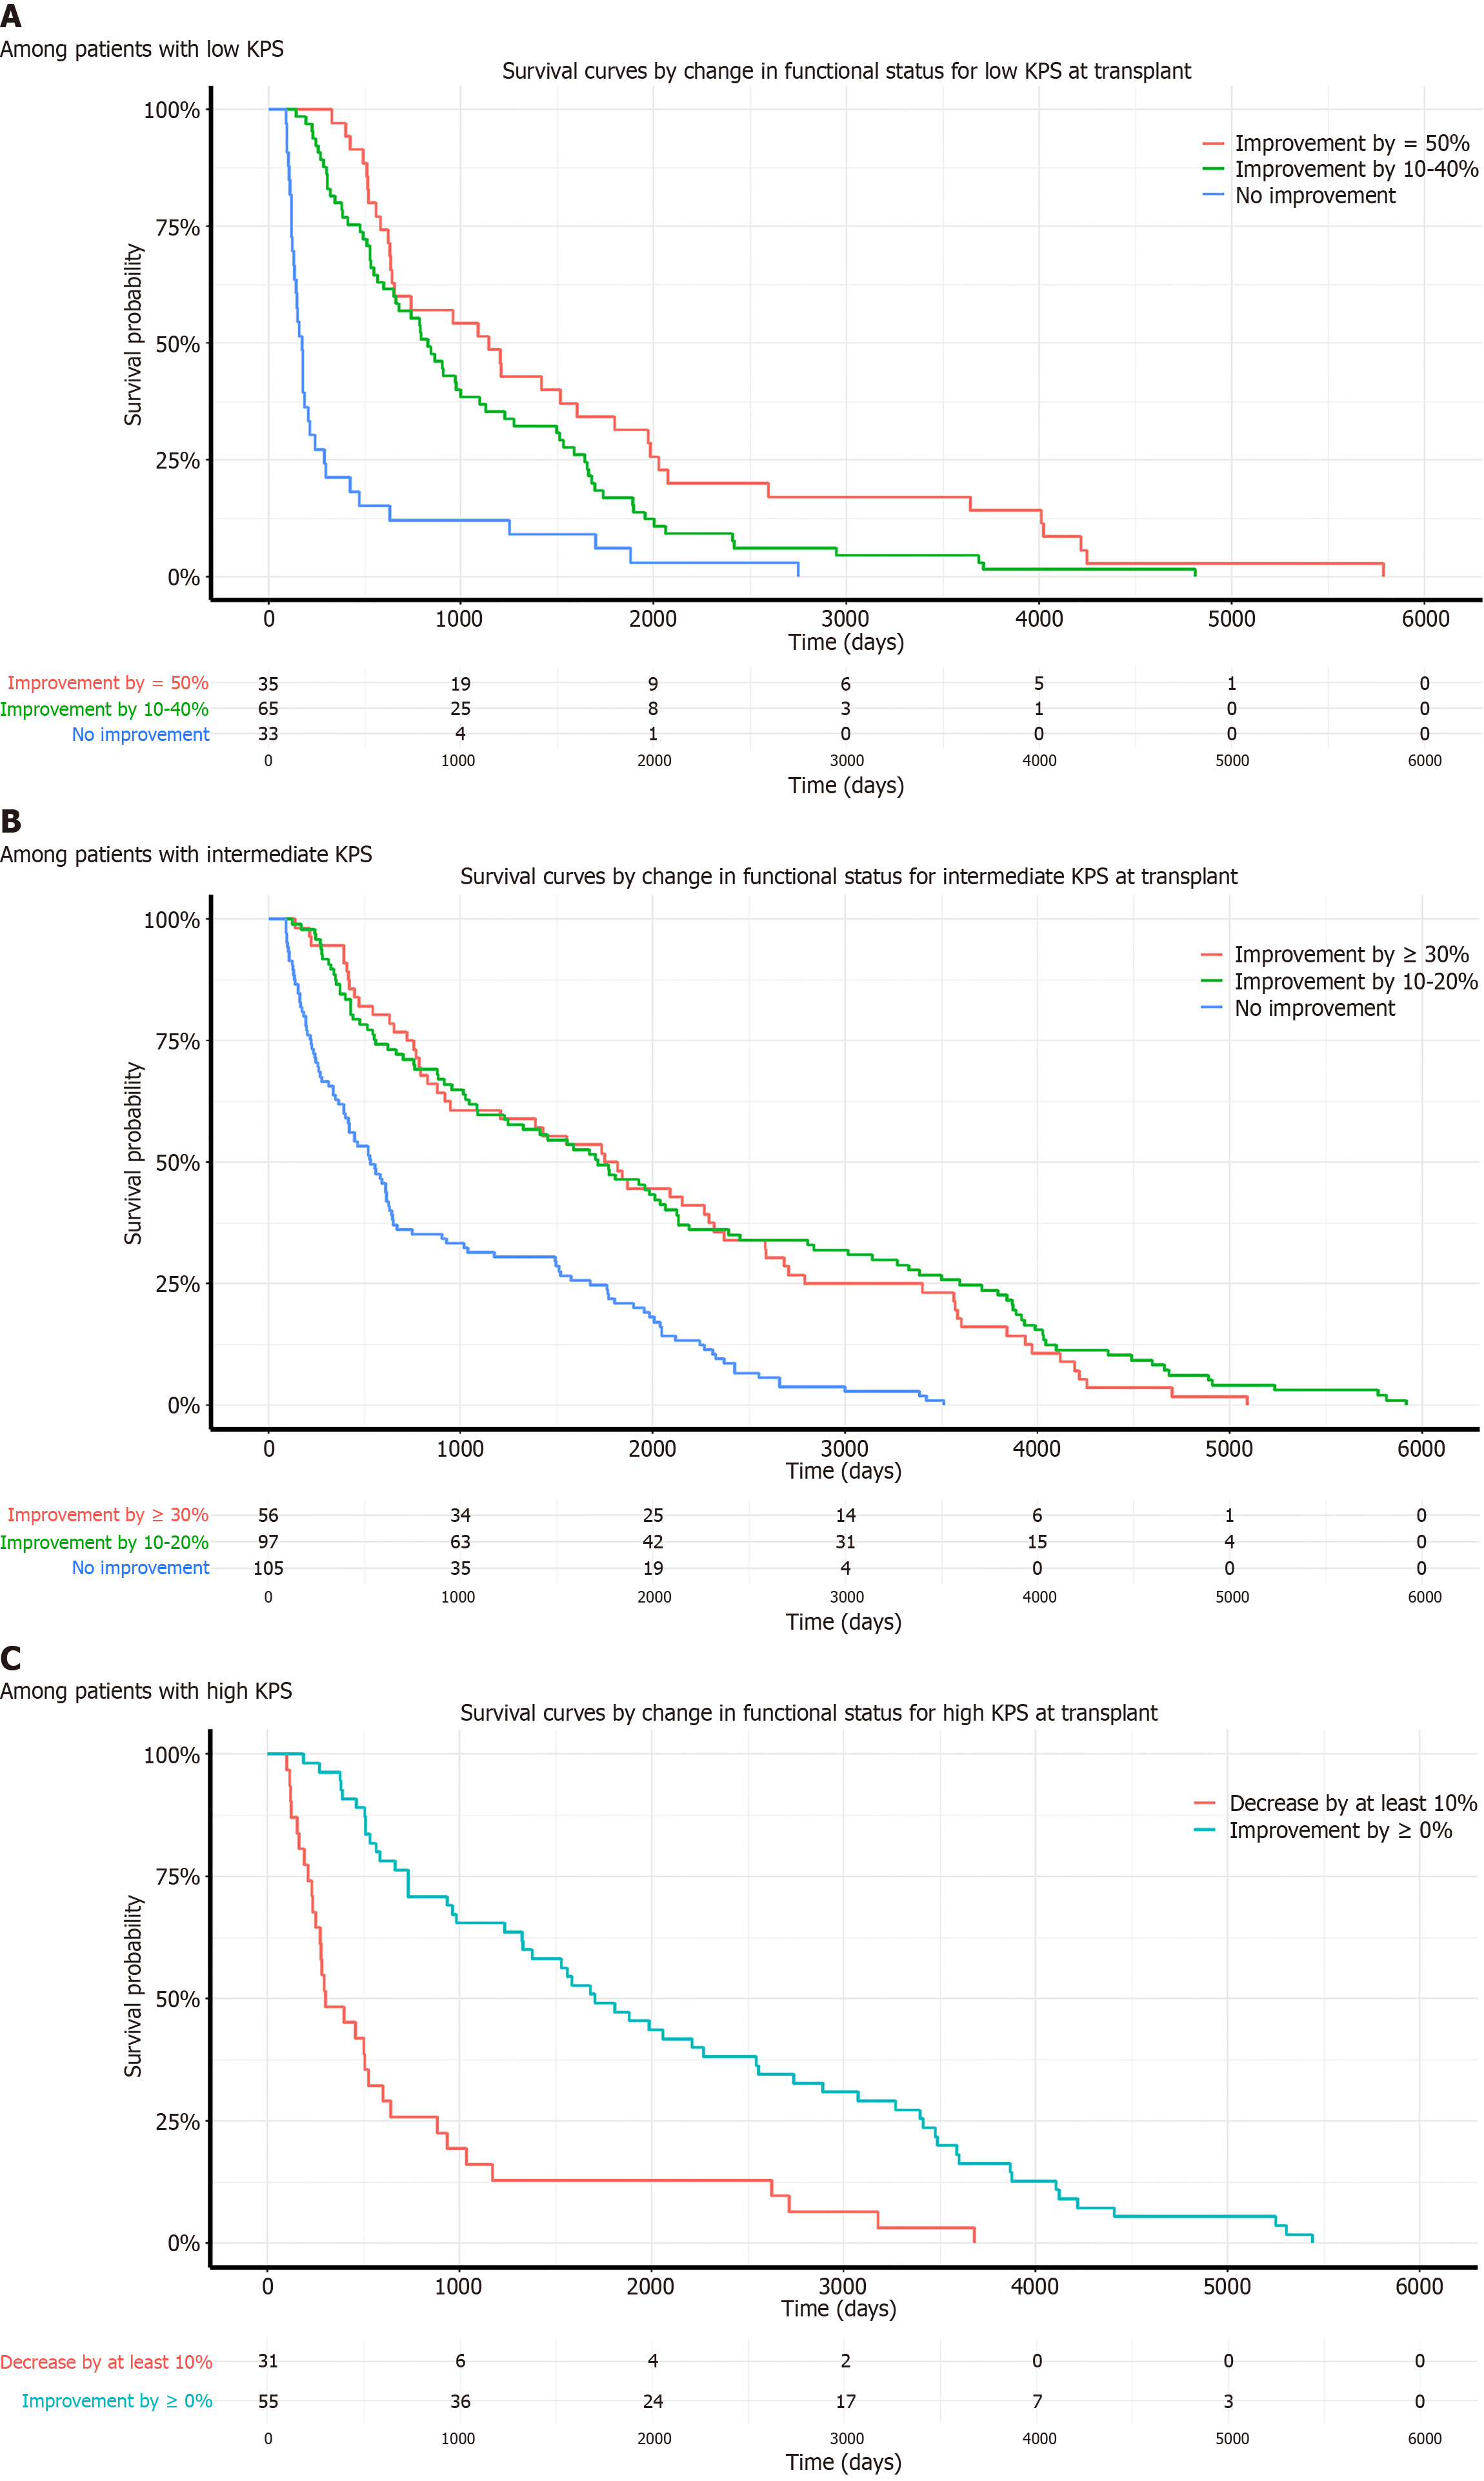
Figure 4 Post transplant survival probability curves of intestinal transplant recipients by Changes in Karnofsky Performance Status after transplant.
A: Among patients with low Karnofsky Performance Status (KPS). Survival curves illustrating post-transplant survival probability for recipients with low KPS at the time of transplant. The categories are based on the improvement in KPS: Red for "Improvement by ≥ 50%", Green for "Improvement by 10%-40%" and Blue for "No improvement". Numbers at risk at various time points are displayed below the x-axis for each category; B: Among patients with intermediate KPS. Survival curves illustrating post-transplant survival probability for recipients with intermediate KPS at the time of transplant. The categories are based on the improvement in KPS: Red for "Improvement by ≥ 30%, "Green for "Improvement by 10%-20%" and Blue for "No improvement". Numbers at risk at various time points are displayed below the x-axis for each category; C: Among patients with high KPS. Survival curves illustrating post-transplant survival probability for recipients with high KPS at the time of transplant. The categories are based on the change in KPS: Red for "Decrease by at least 10%" and Blue for "Improvement by ≥ 0%". Numbers at risk at various time points are displayed below the x-axis for each category.
- Citation: Boateng S, Ameyaw P, Gyabaah S, Adjepong Y, Njei B. Recipient functional status impacts on short and long-term intestinal transplant outcomes in United States adults. World J Transplant 2024; 14(3): 93561
- URL: https://www.wjgnet.com/2220-3230/full/v14/i3/93561.htm
- DOI: https://dx.doi.org/10.5500/wjt.v14.i3.93561


