Copyright
©The Author(s) 2024.
World J Transplant. Sep 18, 2024; 14(3): 93561
Published online Sep 18, 2024. doi: 10.5500/wjt.v14.i3.93561
Published online Sep 18, 2024. doi: 10.5500/wjt.v14.i3.93561
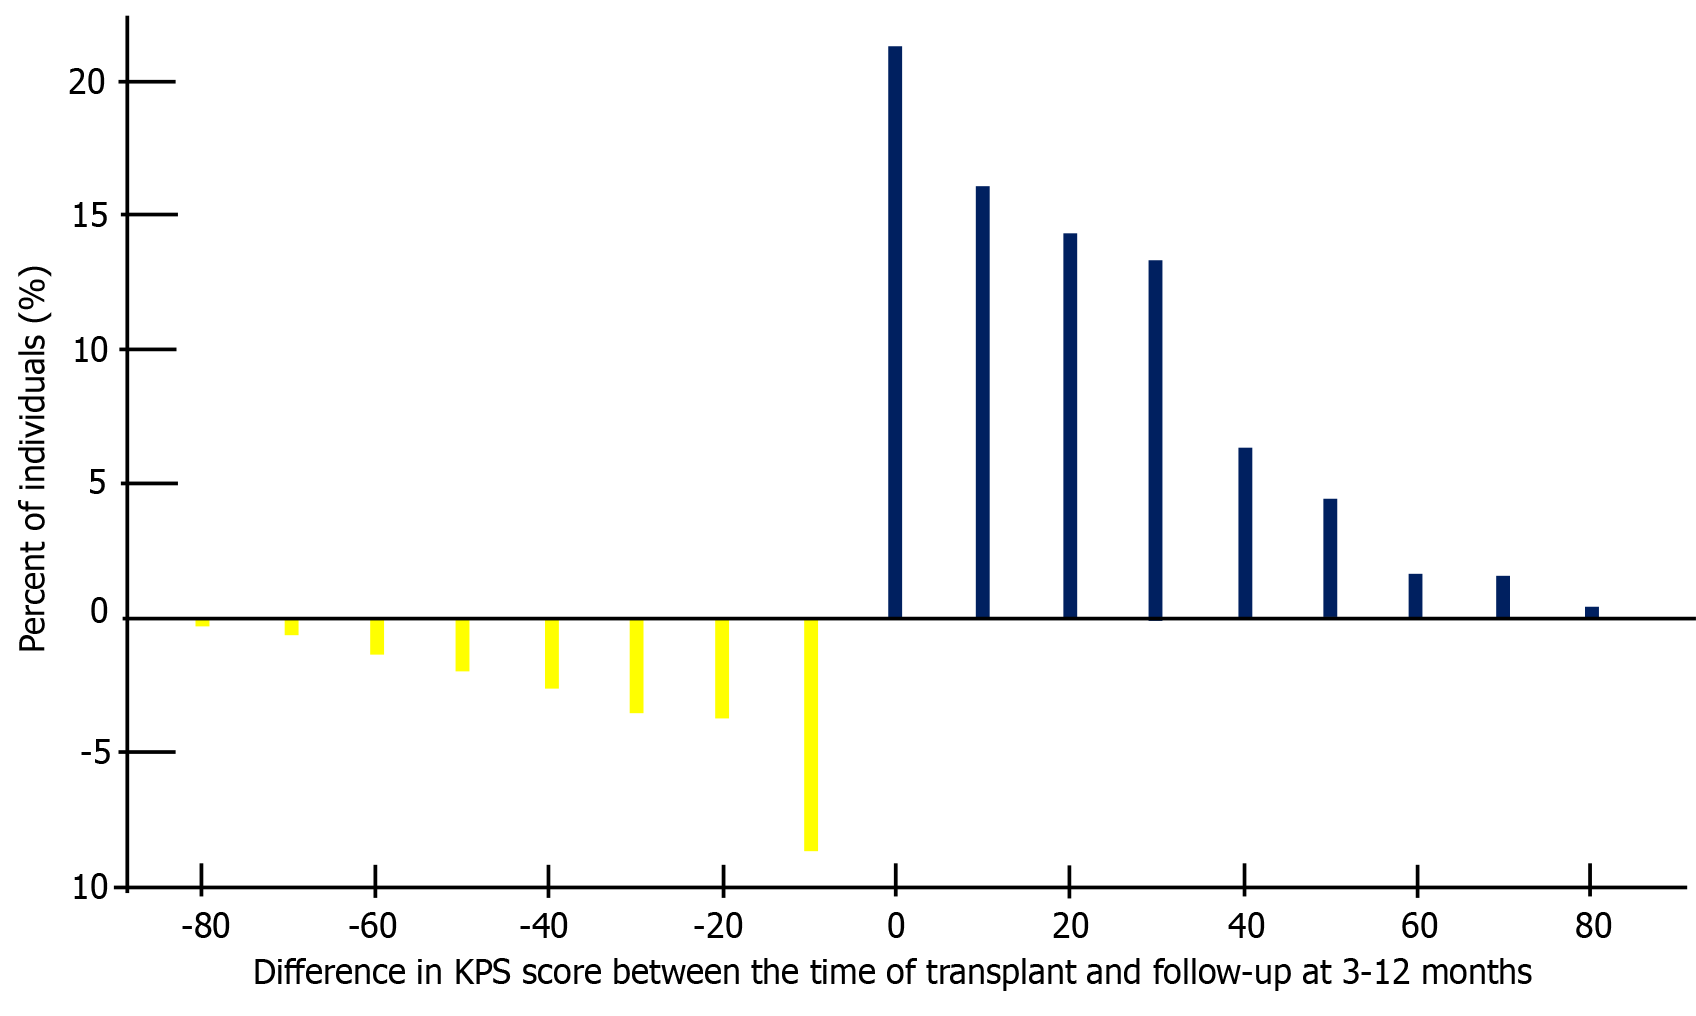
Figure 3 Distribution Karnofsky Performance Status score difference between the time of transplant and at follow-up.
Distribution of the difference in Karnofsky Performance Status (KPS) scores between the time of transplant and follow-up at 3-12 months. The x-axis represents the difference in KPS scores, with negative values indicating a decrease and positive values indicating an improvement. The y-axis represents the percentage of individuals. Yellow bars indicate a decrease in KPS, while blue bars indicate an improvement. KPS: Karnofsky Performance Status.
- Citation: Boateng S, Ameyaw P, Gyabaah S, Adjepong Y, Njei B. Recipient functional status impacts on short and long-term intestinal transplant outcomes in United States adults. World J Transplant 2024; 14(3): 93561
- URL: https://www.wjgnet.com/2220-3230/full/v14/i3/93561.htm
- DOI: https://dx.doi.org/10.5500/wjt.v14.i3.93561


