Copyright
©The Author(s) 2016.
World J Rheumatol. Jul 12, 2016; 6(2): 23-29
Published online Jul 12, 2016. doi: 10.5499/wjr.v6.i2.23
Published online Jul 12, 2016. doi: 10.5499/wjr.v6.i2.23
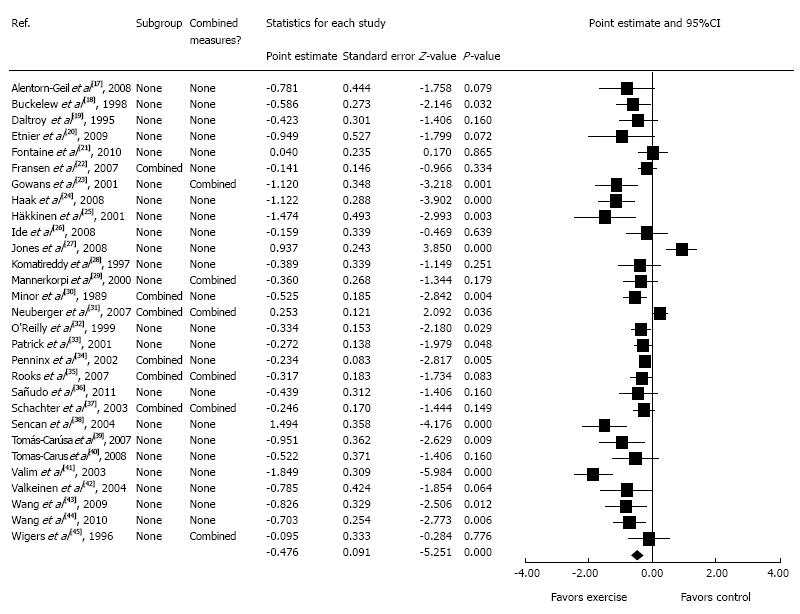
Figure 1 Forest plot for changes in depressive symptoms.
The black squares represent the mean difference while the left and right extremes of the squares represent the corresponding 95%CIs. The middle of the black diamond represents the overall mean difference while the left and right extremes of the diamond represent the corresponding 95%CIs.
- Citation: Kelley GA, Kelley KS. Exercise reduces depressive symptoms in adults with arthritis: Evidential value. World J Rheumatol 2016; 6(2): 23-29
- URL: https://www.wjgnet.com/2220-3214/full/v6/i2/23.htm
- DOI: https://dx.doi.org/10.5499/wjr.v6.i2.23


