Copyright
©2014 Baishideng Publishing Group Inc.
World J Rheumatol. Jul 12, 2014; 4(2): 14-21
Published online Jul 12, 2014. doi: 10.5499/wjr.v4.i2.14
Published online Jul 12, 2014. doi: 10.5499/wjr.v4.i2.14
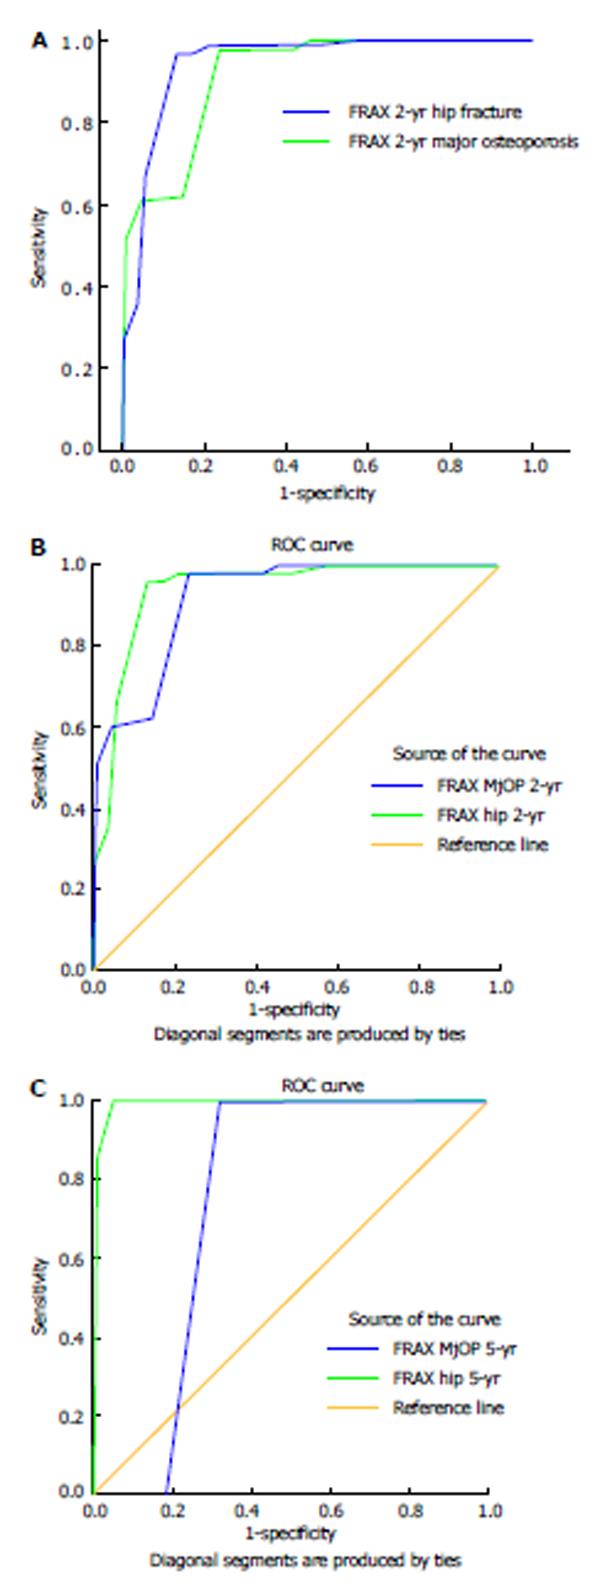
Figure 4 ROC curve displaying discriminating ability of 10 years the World Health Organization fracture risk assessment tool major osteoporosis and hip fracture probability at 2 years in prediction of fracture.
A and B: At 2 years [The AUC for he World Health Organization fracture risk assessment tool (FRAX) major osteoporosis fracture: 0.916 and FRAX hip fracture 0.94]; C: At 5 years [The AUC for he World Health Organization fracture risk assessment tool (FRAX) major osteoporosis fracture: 0.748 and FRAX hip fracture 0.992]. AUC: Area under the curve; ROC: Receiver operating characteristic; MjOP: Major osteoporosis fracture.
- Citation: Miedany YE, Gaafary ME, Yassaki AE, Youssef S, Nasr A, Ahmed I. Monitoring osteoporosis therapy: Can FRAX help assessing success or failure in achieving treatment goals? World J Rheumatol 2014; 4(2): 14-21
- URL: https://www.wjgnet.com/2220-3214/full/v4/i2/14.htm
- DOI: https://dx.doi.org/10.5499/wjr.v4.i2.14


