Copyright
©2013 Baishideng Publishing Group Co.
World J Med Genet. Nov 27, 2013; 3(4): 41-54
Published online Nov 27, 2013. doi: 10.5496/wjmg.v3.i4.41
Published online Nov 27, 2013. doi: 10.5496/wjmg.v3.i4.41
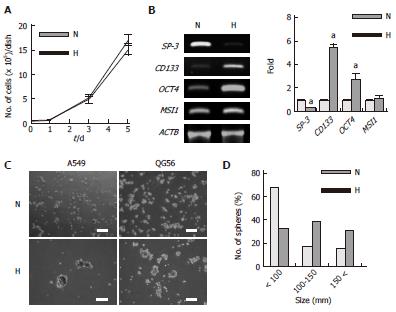
Figure 5 Changes in gene expression and sphere-forming activity of A549 and QG56 cells under hypoxic conditions.
The cells were cultured under normoxic (N) or hypoxic (4% O2) (H) conditions. A: Growth of A549 cells. Bars, SD (n = 3); B: Differentiation- and stem cell-related gene expression in A549 cells, the cells were cultured for 5 d, data are shown as fold-change relative to normoxia (normoxia values set to equal 1), aP < 0.05 (n = 3); C: Sphere formation; A549 or QG56 cells pre-cultured under normoxic or hypoxic (1% O2) conditions for 2 d were reseeded in BEBM supplemented with various additives (see Materials and Methods) and then further cultured for 7 d; Left panels represent A549 cells and right panels represent QG56 cells. Scale bars = 200 μm; D: Size distribution of the spheres formed by A549 cells.
- Citation: Akimoto M, Nagasawa H, Hori H, Uto Y, Honma Y, Takenaga K. An inhibitor of HIF-α subunit expression suppresses hypoxia-induced dedifferentiation of human NSCLC into cancer stem cell-like cells. World J Med Genet 2013; 3(4): 41-54
- URL: https://www.wjgnet.com/2220-3184/full/v3/i4/41.htm
- DOI: https://dx.doi.org/10.5496/wjmg.v3.i4.41


