Copyright
©The Author(s) 2015.
World J Clin Infect Dis. May 25, 2015; 5(2): 44-50
Published online May 25, 2015. doi: 10.5495/wjcid.v5.i2.44
Published online May 25, 2015. doi: 10.5495/wjcid.v5.i2.44
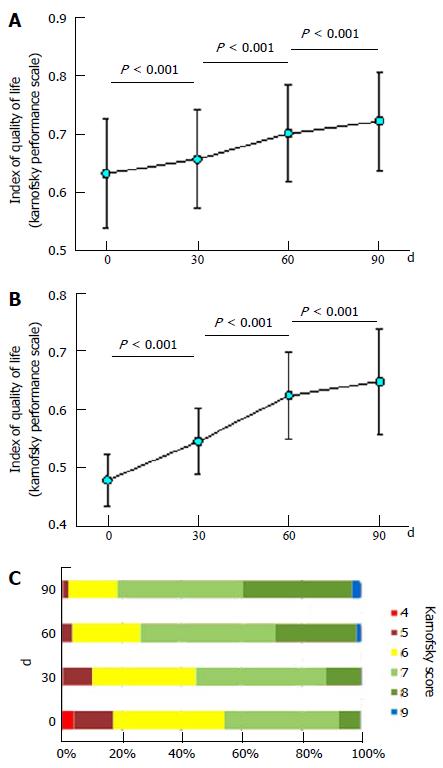
Figure 4 Quality of life of study participants based on the Karnofsky score.
A: The mean and standard deviation of the Index of Quality of Life score of all study participants and of (B) participants who had a Karnofsky score of 5 or less at the onset of the study; C: The proportions of Karnofsky score at days 0, 30, 60 and 90. The P values of Wilcoxon Signed Rank Tests between each day are shown.
- Citation: Wernik R, Priore JL, Goldman WF, Elias ADC, Borkow G. Improvement in human immunodeficiency virus-1/acquired immune deficiency syndrome patients’ well-being following administration of “Phyto V7”. World J Clin Infect Dis 2015; 5(2): 44-50
- URL: https://www.wjgnet.com/2220-3176/full/v5/i2/44.htm
- DOI: https://dx.doi.org/10.5495/wjcid.v5.i2.44


