Copyright
©The Author(s) 2015.
World J Clin Infect Dis. May 25, 2015; 5(2): 44-50
Published online May 25, 2015. doi: 10.5495/wjcid.v5.i2.44
Published online May 25, 2015. doi: 10.5495/wjcid.v5.i2.44
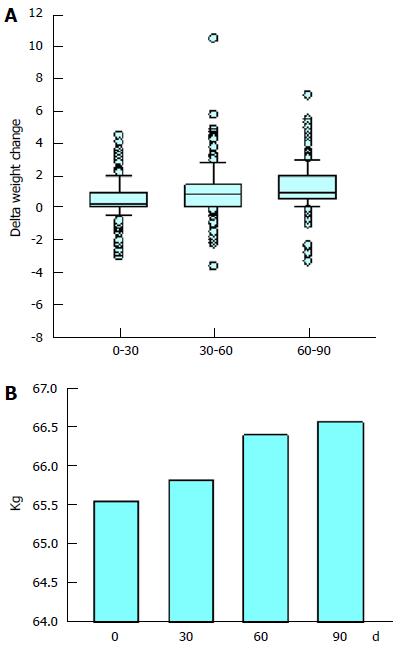
Figure 2 Participant body weight.
A: Box plots describing the delta change in the weight of the study participants. The boxes represent the middle 50% of the data values. The horizontal line across the box marks the median value. The error bars show the 10th and 90th percentiles of the population. Individual data-points falling beyond these boundaries are shown as dots; B: The mean weight of the study participants.
- Citation: Wernik R, Priore JL, Goldman WF, Elias ADC, Borkow G. Improvement in human immunodeficiency virus-1/acquired immune deficiency syndrome patients’ well-being following administration of “Phyto V7”. World J Clin Infect Dis 2015; 5(2): 44-50
- URL: https://www.wjgnet.com/2220-3176/full/v5/i2/44.htm
- DOI: https://dx.doi.org/10.5495/wjcid.v5.i2.44


