Copyright
©The Author(s) 2022.
World J Clin Infect Dis. Apr 26, 2022; 12(1): 1-19
Published online Apr 26, 2022. doi: 10.5495/wjcid.v12.i1.1
Published online Apr 26, 2022. doi: 10.5495/wjcid.v12.i1.1
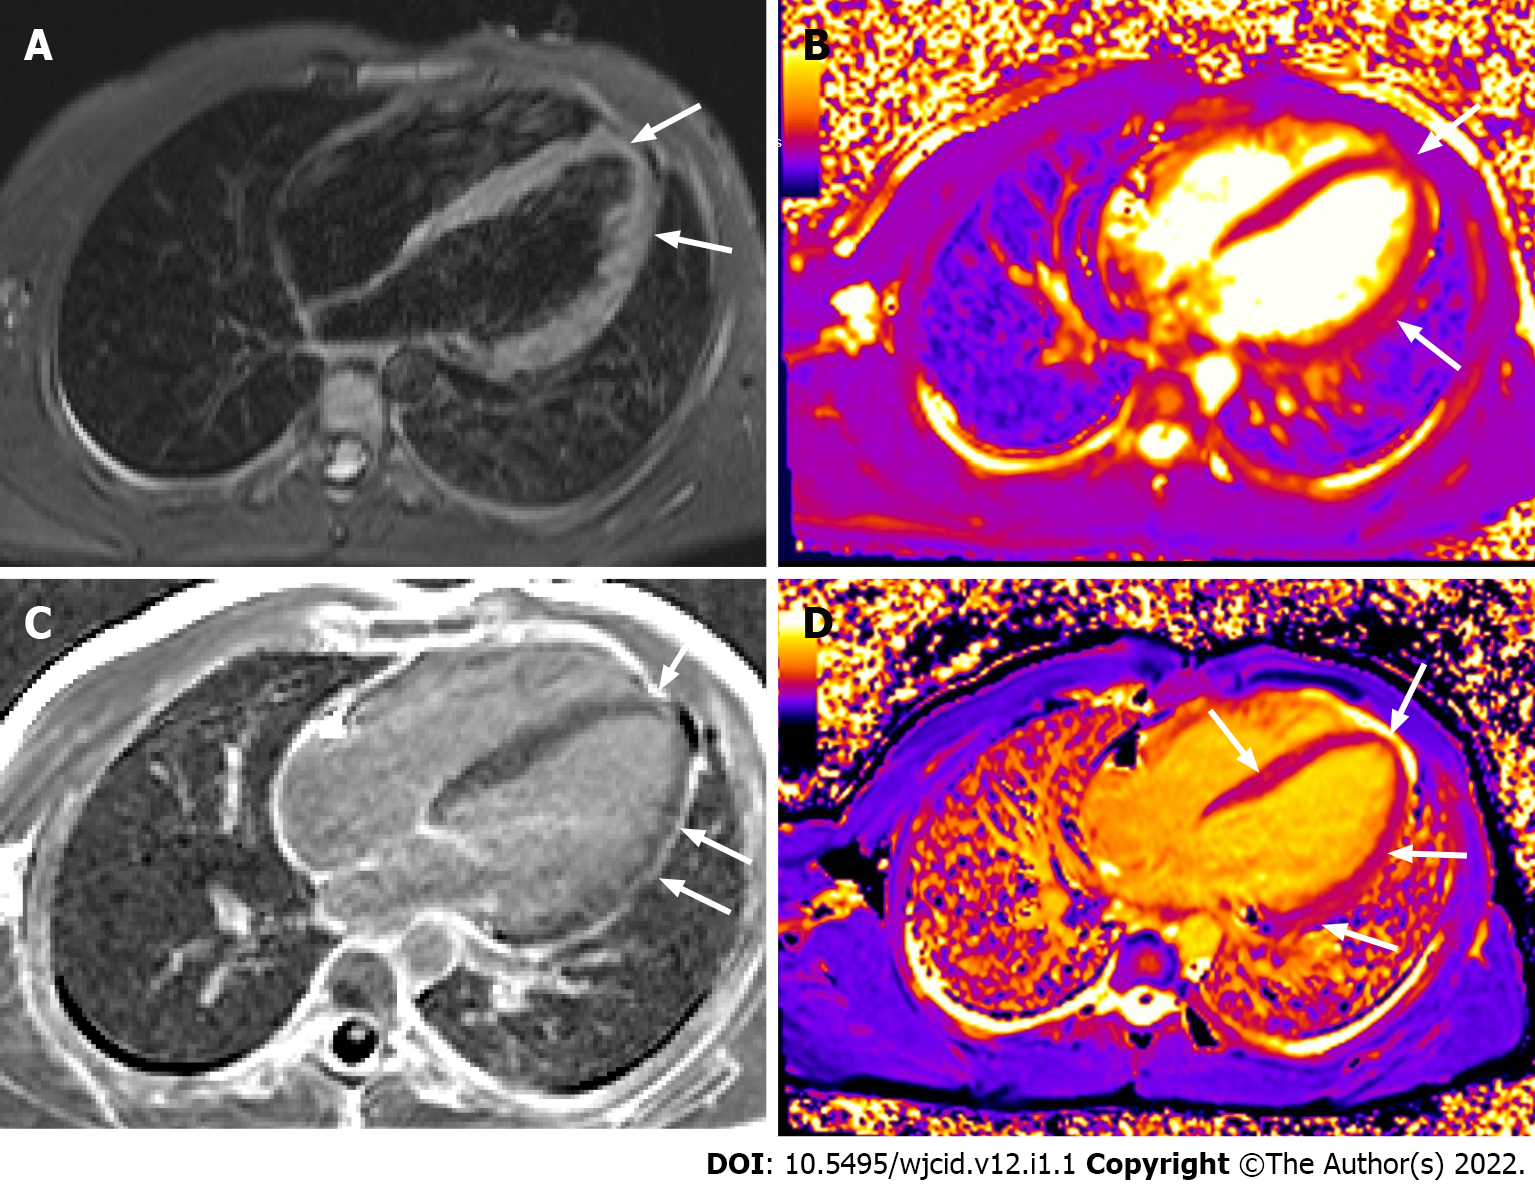
Figure 18 Cardiac magnetic resonance imaging.
Horizontal long axis TIRM image (A) displaying high signal in the myocardium at the apex and along the free wall of the left ventricle (LV). Horizontal long axis T2 (B) and T1 (D) mapping depicting prolonged T2 and T1 relaxation times at the same area and in the middle septum (D). Horizontal long axis image post gadolinium administration (C) showing late enhancement at the apex and along the free wall of LV. There is also pericardial enhancement along the free wall of LV.
- Citation: Ilieva E, Boyapati A, Chervenkov L, Gulinac M, Borisov J, Genova K, Velikova T. Imaging related to underlying immunological and pathological processes in COVID-19. World J Clin Infect Dis 2022; 12(1): 1-19
- URL: https://www.wjgnet.com/2220-3176/full/v12/i1/1.htm
- DOI: https://dx.doi.org/10.5495/wjcid.v12.i1.1


