Copyright
©The Author(s) 2022.
World J Clin Infect Dis. Apr 26, 2022; 12(1): 1-19
Published online Apr 26, 2022. doi: 10.5495/wjcid.v12.i1.1
Published online Apr 26, 2022. doi: 10.5495/wjcid.v12.i1.1
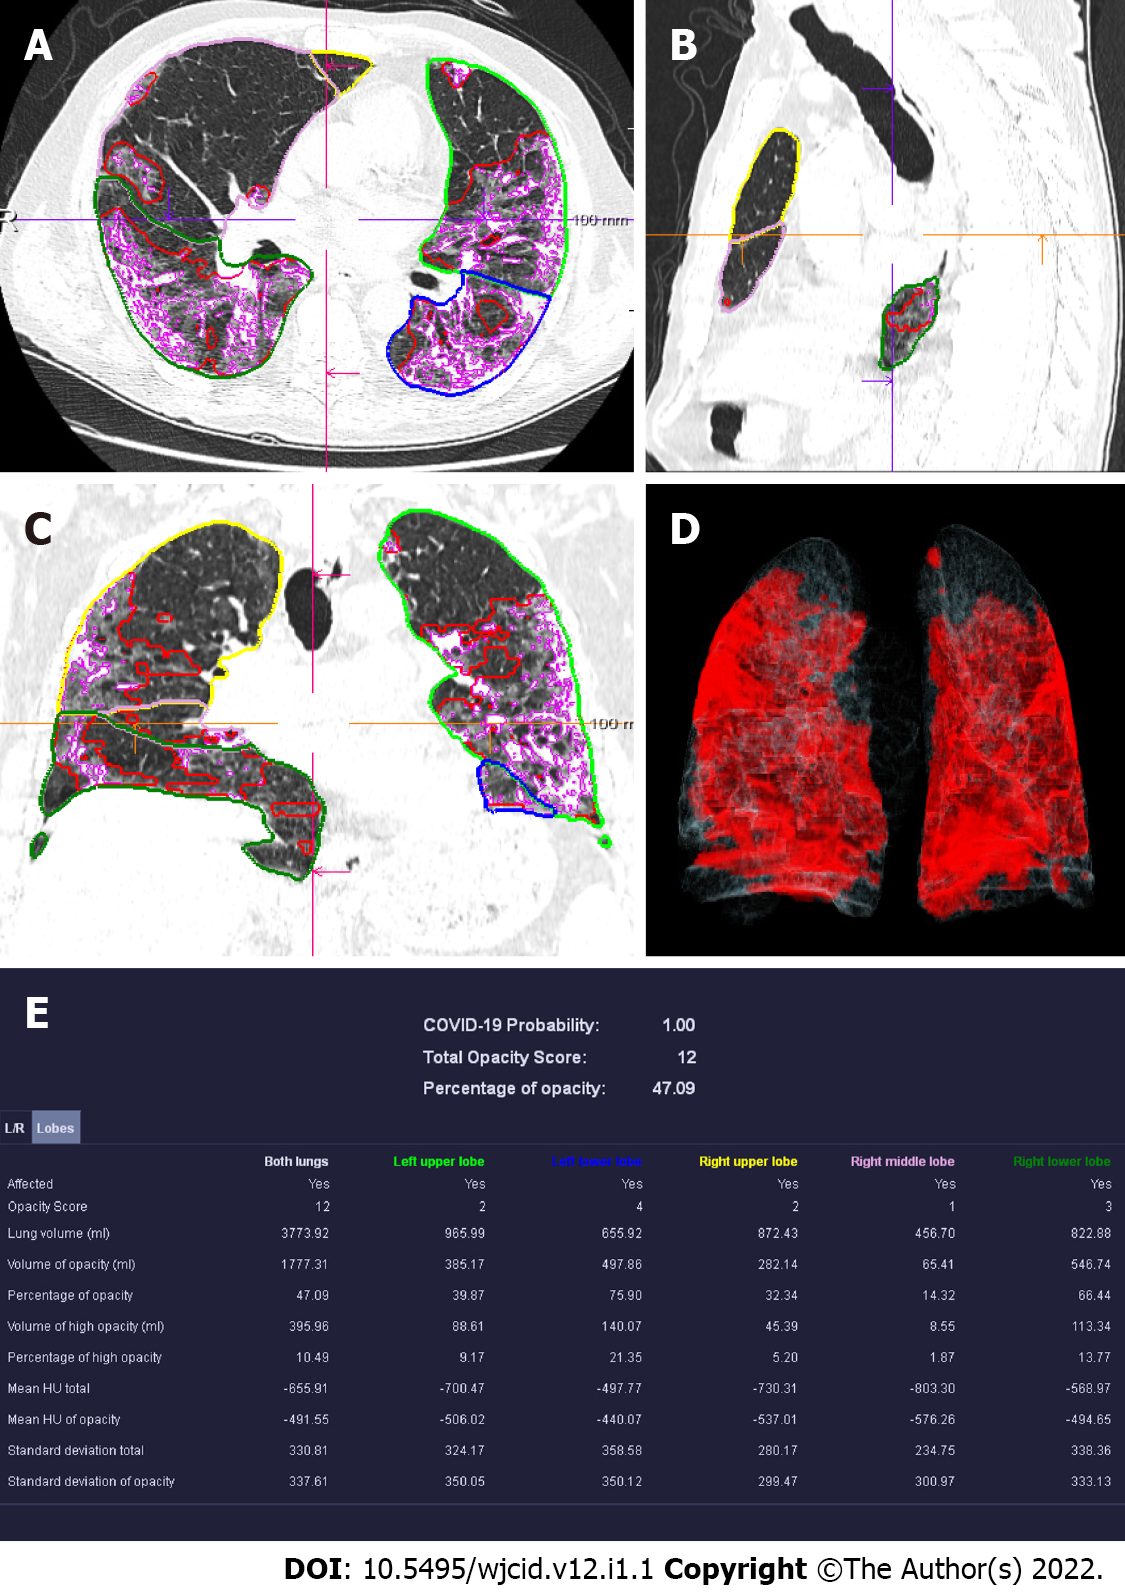
Figure 13 Computed tomography pneumonia analysis (automated lung opacity analysis).
A-C: Мulti-planar reconstruction views overlaid with delineations of the opacities and the lungs; D: Volume rendering image showing a quick overview of the spatial distribution of the opacities; E: Table with measurements demonstrating relative (“percentage of opacities”) and absolute volume of opacities, mean and standard deviation of HU values between lung parenchyma and the detected opacities, separately segmented quantitative results per left and right lung and per lung lobe.
- Citation: Ilieva E, Boyapati A, Chervenkov L, Gulinac M, Borisov J, Genova K, Velikova T. Imaging related to underlying immunological and pathological processes in COVID-19. World J Clin Infect Dis 2022; 12(1): 1-19
- URL: https://www.wjgnet.com/2220-3176/full/v12/i1/1.htm
- DOI: https://dx.doi.org/10.5495/wjcid.v12.i1.1


