Copyright
©The Author(s) 2025.
World J Exp Med. Jun 20, 2025; 15(2): 105798
Published online Jun 20, 2025. doi: 10.5493/wjem.v15.i2.105798
Published online Jun 20, 2025. doi: 10.5493/wjem.v15.i2.105798
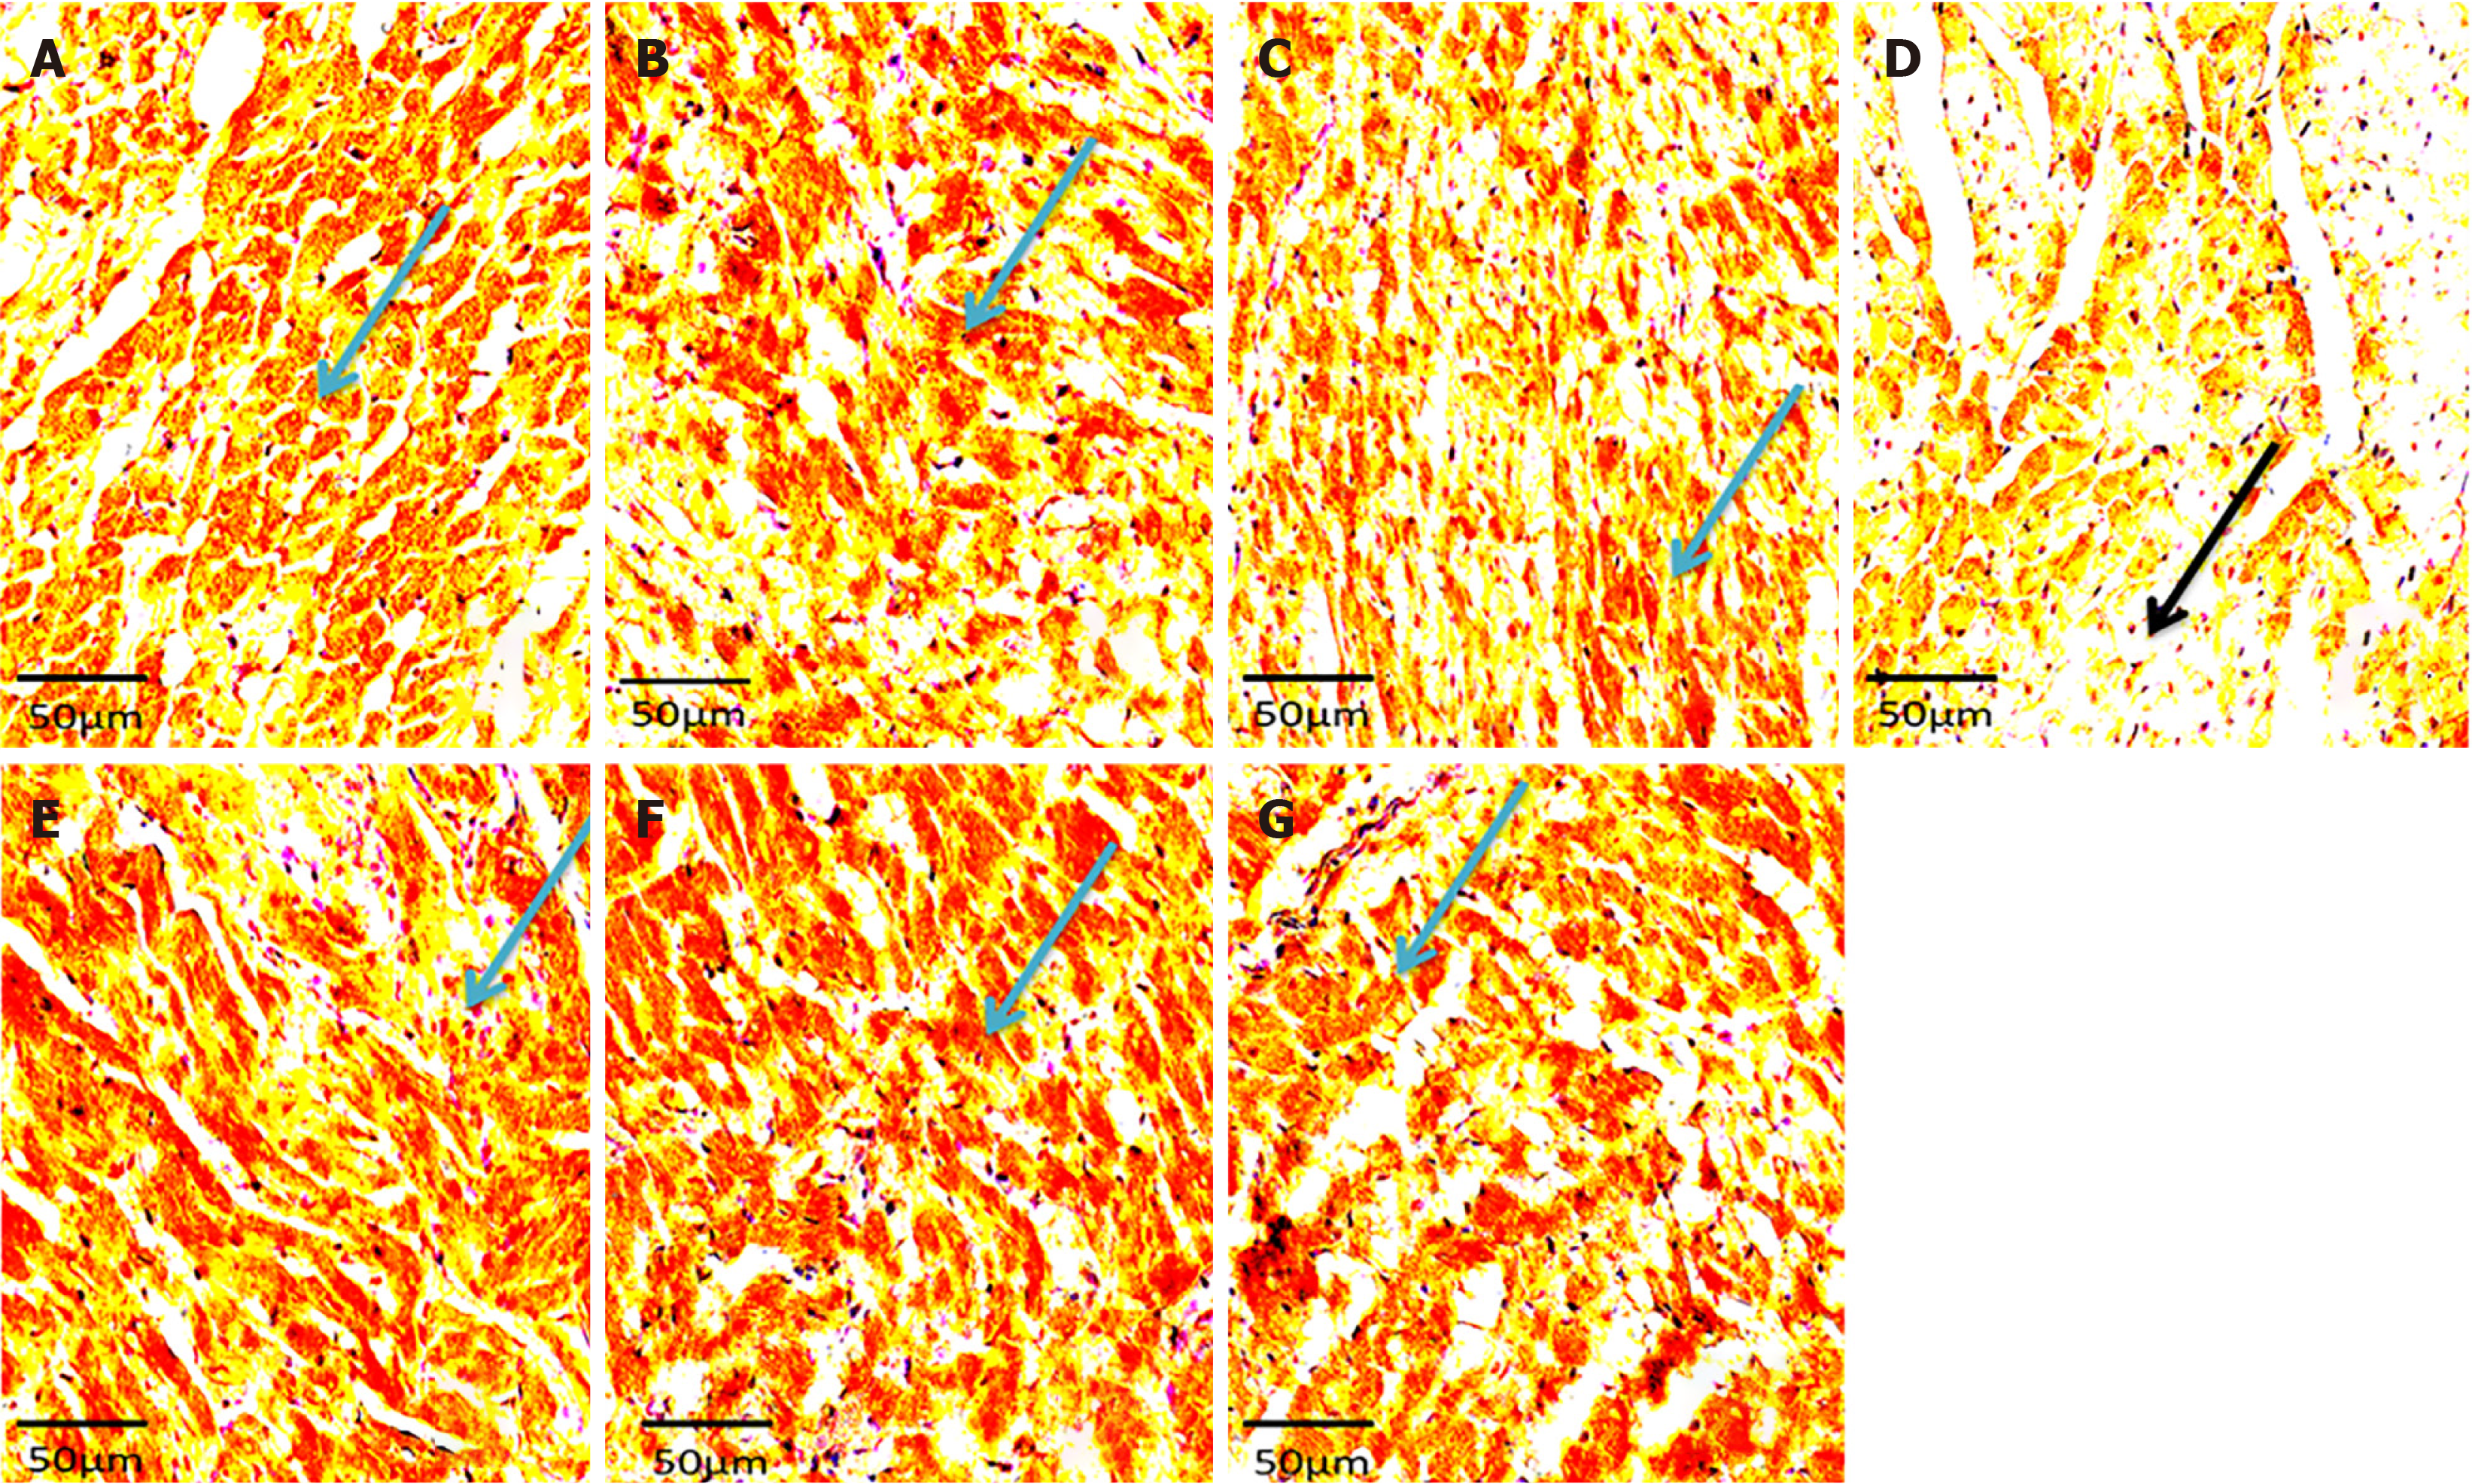
Figure 4 Showing photomicrographs of left ventricles of treated and control groups of Wistar rats grouped.
A-G: Blue arrows-immunoreactive cells, black arrow–immunonegative cells (CnTI × 400). A: Normal control group; B: Received 10% white melon seed protein (WSP) biscuit meal only; C: Received 20% WSP biscuit meal only; D: Orally received 300 mg/L sodium fluoride (NaF) in drinking water; E: Received 300 mg/L NaF + Lisinopril (10 mg/kg bwt); F: Received 300 mg/L NaF + 10% WSP biscuit meal; G: Received 300 mg/L NaF and 20% WSP biscuit meal.
- Citation: Fasakin OW, Awosika A, Ogunsanya ST, Benson IO, Olopoda AI. Anti-hypertensive effect of enriched white melon seed protein concentrate biscuit on sodium fluoride exposed rats. World J Exp Med 2025; 15(2): 105798
- URL: https://www.wjgnet.com/2220-315x/full/v15/i2/105798.htm
- DOI: https://dx.doi.org/10.5493/wjem.v15.i2.105798


